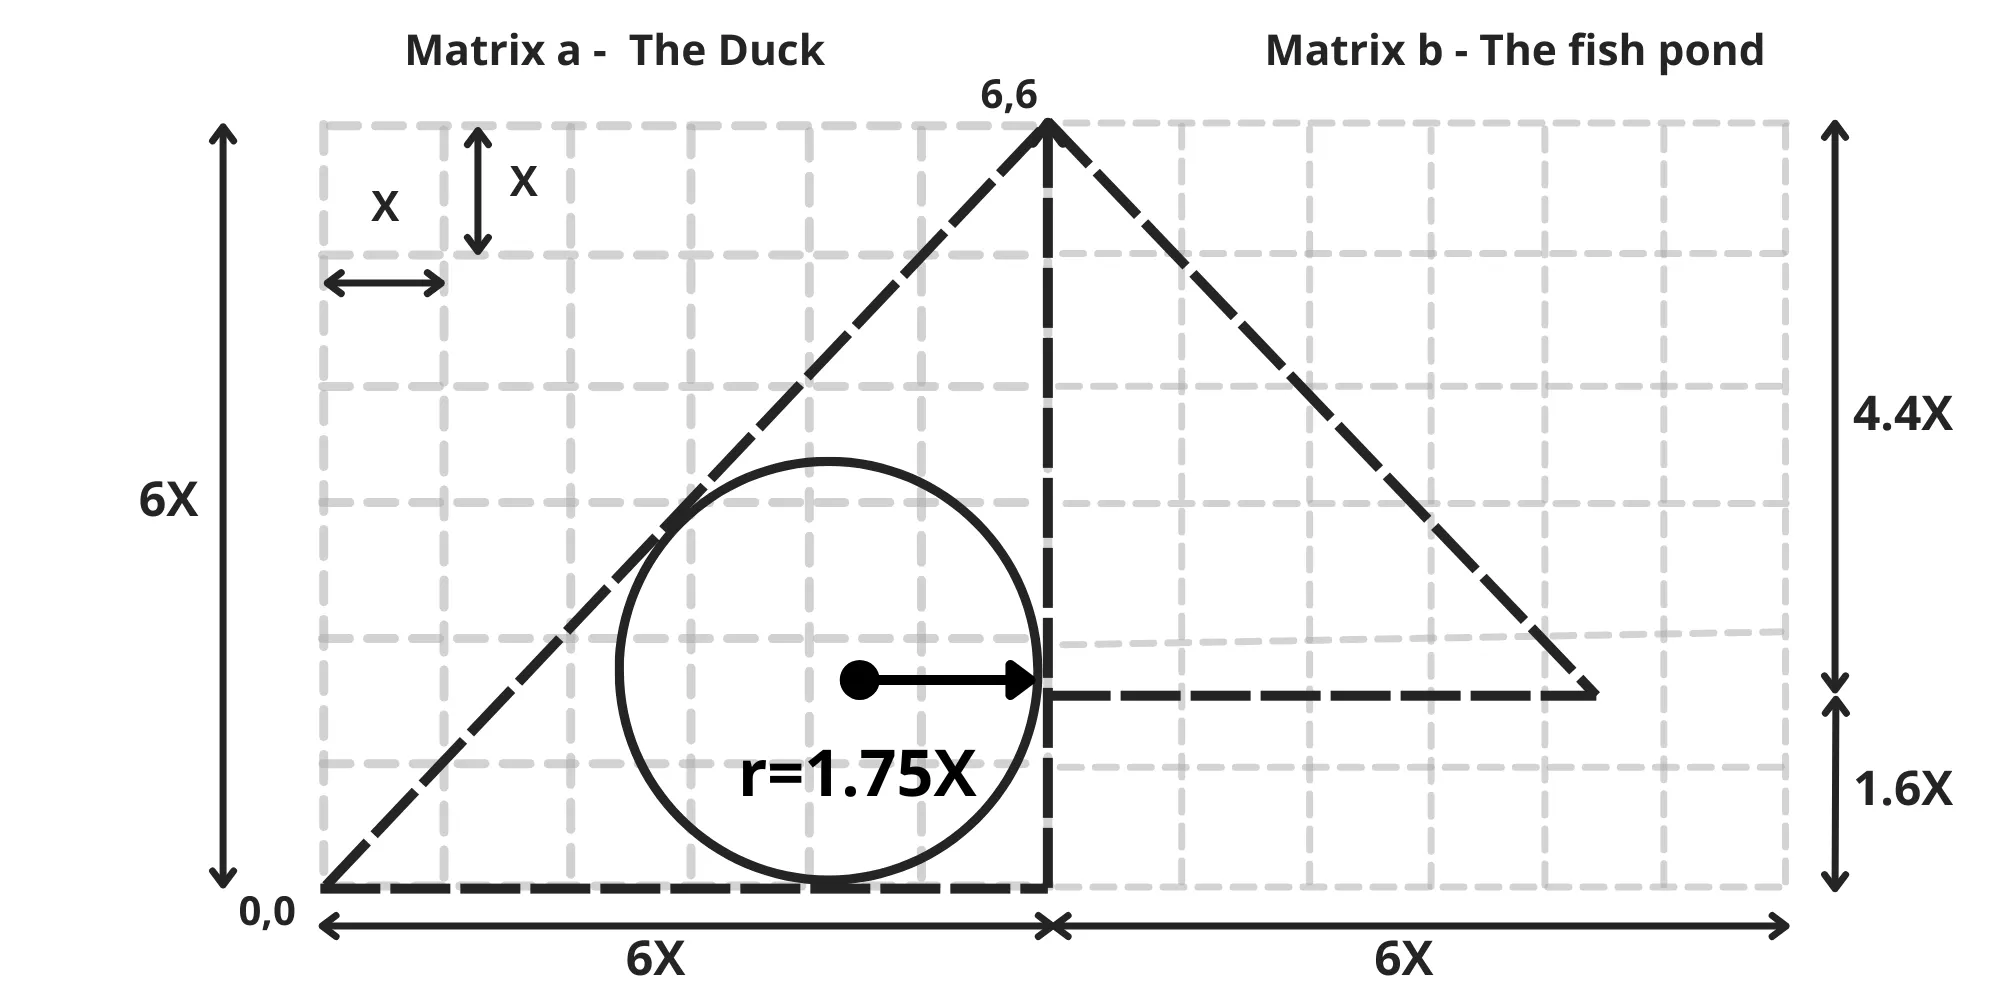
Many of the world’s most intricate systems, codes, and games are deeply anchored in mathematical matrices. Chess, for example, embodies a pinnacle of complexity, meticulously organized on an 8x8 grid, while tic-tac-toe (X and O) distills this concept into the simplicity of a 3x3 matrix. Yet, the most valuable secret of all time, and the most sought-after code in history - the financial code that underpins modern economic systems - is, at its essence, a deceptively simple mathematical game when fully decoded. Unlike chess, structured on an 8x8 matrix, or tic-tac-toe, which operates on a 3x3 grid, this profound financial code is founded on a dual-matrix framework: two 6x6 square matrices. Matrix A (The Duck) and Matrix B (The Fish Pond) function in perfect harmony, forming a continuous cycle that encapsulates the perpetual rhythms of growth and decline - the core dynamics shaping the financial systems of the modern world. This revolutionary framework is known as The-Duck-Code. However, before we can uncover the full depth of The Duck Code, we must first explore the mathematical tale that serves as the foundation for the creation and evolution of global financial markets. Only through understanding this narrative can we begin to unravel and decode the secrets of The Duck Code. Once Upon a Time Beginnings In a tranquil, faraway lake, nestled in the top-left corner of a 6×6 square matrix with 36 squares, a baby duck takes its first breath at position (0,0). Modest yet eye-catching, it emerges as a yellow isosceles right-angled triangle. (image 1) Duck characteristics The top point of the triangle is the duck’s head, always reaching upward. Inside its yellow body, the duck carries a blue, round stomach, a perfect circle nestled within. From the very beginning, it also bears a gray backpack, shaped like another triangle that mirrors its body, growing symmetrically behind it. As the duck matures, the backpack expands, growing alongside it and gradually stretching until, one day, it will fill the entire upper half of the matrix a. (image 2) Ultimate Quest From the moment of its creation, the duck’s sole purpose was clear: to escape the matrix. But to achieve this, it first had to complete two critical missions: Reach its maximum height within Matrix a, and Fill over 50% of its backpack with water (image 3) First Mission In the first six stages of its life, the duck’s mission is straightforward: to grow to its maximum size within Matrix a. To accomplish this, the duck begins drinking water from the lake, expanding its round stomach and initiating its growth. Its growth is steady and consistent, progressing along the diagonal of the matrix at a 45° angle. Over the course of six equal stages, the duck becomes taller and larger with each step (image 4-5). By the end of these six stages, its body (represented by a yellow triangle) covers the lower half of the matrix. (image 5) First mission completed When our duck reaches its maximum height of 6X, its stomach has a radius of r=1.75X, and its head is located at the coordinate (6,6). The surface area of the duck's body now measures 18X². (image 6) The first mission has been successfully completed by the duck. Final Mission - Matrix b - the fish pond The duck is now ready for its next challenge. To escape the matrix, it must complete its final mission: filling over half of its backpack with a water reserve for its journey beyond the matrix. To complete its mission, Matrix b - The fish pond enters the scene (image 7). This square matrix, identical to Matrix a, represents a nearby pond filled with fish. The pond is split into two sections by its diagonal: The lower half, brimming with fish, stretches from bottom to top. The upper half is entirely filled with water. Solution To fill its backpack with water, the duck has only one solution: it must plunge its beak deeper and deeper into the fish pond and eat fish until all the water in its stomach is transferred to the backpack. When the duck plunges its beak, shaped like a red isosceles right triangle, into a surface area of X², it swallows an equivalent amount of fish - X², which is stored in its stomach. Since the stomach is already filled with water, each fish that enters displaces an equal volume of water, which is expelled through an opening into the backpack. (image 9) As a result, the backpack gradually fills with water, while the water balloon in the stomach steadily decreases in diameter. The duck continues this process - plunging its beak into the pond - until its stomach is completely filled with fish and all the water has been transferred to the backpack, achieving equilibrium. (image 9,10,11,12) After consuming the final fish that fit into its stomach, our duck successfully swallowed a total of 9.7X² fish, enabling it to expel the entire volume of water from its stomach, 9.7X², and store it in the backpack. With the backpack having a total capacity of 18X², it is now filled to 54%, fulfilling the requirements of its final mission! (image 13) To accomplish this, the duck first underwent 6 stages of rectilinear and uniform growth within the Matrix a - The Duck, reaching a height of 6X, with its water-filled stomach expanding to a radius of 1.75X. Then, over another 6 stages, within the Matrix b -The fish pond, the duck had to plunge its beak into the fish pond uniformly at a 45-degree angle, to a depth of h = 4.4X, measured from its head to the bottom. This depth accounted for 73% of the pond's height (6X) and required the duck to consume 54% (9.7X²) of the total fish population (18X²) in the pond. (image 14) All these conditions met allowed the duck to fill more than 50% of the backpack's capacity with water, enabling it to leave the matrix. It may seem unbelievable, but what lies before you - two isosceles right triangles and a circle, arranged on two 6x6 matrices - represents the very foundation of the financial laws that shape our world today. (image 17) However, to fully decode and comprehend the entire code, we must explore the Saint Nicholas Balloons Theorem - the first framework that reveals the core mathematical principles underpinning the formation of all financial markets. Saint Nicholas Balloons Theorem Since the dawn of financial markets, society has been conditioned to believe that the price chart line is the ultimate indicator of value. In reality, the most critical measure lies not in the line itself, but in the area beneath it. According to the Balloon Theorem, this area is precisely filled with balloons of varying sizes, each representing holders and the value of the stack they own. Furthermore, the arrangement of these balloons and their dynamics entirely determine the shape of the chart and the evolution of the price. Bubble map, radius of the balloon The area of each balloon (circle) is given by the product of the quantity of assets a holder owns (n) and the price of the asset (p) - Scircle = np. The average sell price is calculated at the center of the balloon. At the same time, the area of the circle is calculated using the standard mathematical formula Scircle = πr². By equating the two equations, we can derive the formula for the radius of the balloon. This formula enables the representation of each holder and the value of their stake as a circle, quantifying the space they occupy on the chart. This visualization creates a Bubble Map of the holders, where all bubbles are balanced and strategically positioned beneath the chart. (image 19) Fall formula Introduction Visualize a price chart as a blue rope resting on a collection of balloons of various sizes, all balanced in equilibrium. If the large blue balloon pops, the rope will collapse into the void left by the burst balloon, disrupting the entire structure. This disruption will naturally lead to the remaining balloons rearranging themselves until a new state of balance is achieved. This is exactly how the technical modeling of any asset's price chart works. The balloons represent all holders and the value of their stakes, geometrically illustrated as circles beneath the chart. When a large holder decides to "pop their balloon" (i.e., withdraw liquidity by selling their assets), the price drops, creating a void equivalent to the space previously occupied by the holder's balloon. Due to the laws of conservation, the area of the red triangle ABC formed under the chart during the drop will be equal to the surface area of the balloon that was popped. From this, we deduce the distance h, or the fall formula: h = 2.5r Fall formula If a large stack held by a holder, represented by a balloon with radius r beneath the chart, is liquidated, the price will drop by a distance of h = 2.5r. Here, h is measured from the lowest point of the candlestick that signals the trend reversal. (image 22) Graph Grid Using the Fall formula, we can understand that the price progresses through six equal phases, both vertically and horizontally, when analyzing the structure of the chart. Specifically, the price chart for a complete pump-and-dump cycle is represented by two 6x6 matrices: one capturing the uptrend and the other depicting the downtrend. Together, these matrices form a balanced framework that maps the entire price movement. Info It’s important to note that the Balloons Theorem focuses exclusively on the area beneath the price chart and is particularly relevant for large balloons (holders with substantial stakes). The study primarily targets the holder with the largest balloon admissible by the chart (the circle inscribed beneath the price graph) and the effects this holder produces. (image 24) The theory aims to demonstrate that, in reality, a single major holder with the largest balloon dominates nearly all significant markets, orchestrates major capital flows, and influences the global economy. To derive the final equations, ideal market conditions were assumed: rectilinear and uniform motion, a 45-degree angle for trends, ideal liquidity conditions, and similarly simplified scenarios. Decoding The Duck Code Now that we have explored the Balloon Theorem and understand, through clear formulas, how the chart is modeled based on the balloons beneath it, we will move on to decoding the most secretive and valuable mathematical story ever written: The Duck Code. Matrix a - The duck The first matrix, called The Duck, is nothing more than the representation of a complete uptrend cycle, where the price of an asset increases rectilinearly and uniformly in 6 equal stages, at a 45° angle. (Image 25) The Duck The circle inscribed in the triangle represents the holder with the largest stack permissible by the chart. It begins accumulating assets right from the start of the chart, maximizing its stack within the first two stages when the asset's price ranges between 0 and 2X, ensuring its maximum stack at an average price of 1X. (image 26) The waiting After securing its maximum stack in the initial stages, the large holder patiently waits until the end of the 6th price stage. According to the Balloon Theorem, we can now precisely calculate what percentage of the area under the chart this holder represents as a circle, as well as the effects triggered when they decide to liquidate their balloon. Of course, there are many other small balloons under the chart that fill the area below, but our calculations focus solely on the largest player. The yellow triangle represents the area below the price chart - Duck body. When all six stages are completed (image 28,29) and the circle reaches its optimal values, the largest holder knows it is time to begin liquidating their balloon and locking in profits. Matrix b - The fish pond To sell such a large quantity and achieve the maximum average price, the big player must sell gradually and uniformly over 5 stages. This is where the second matrix, The Fish Pond, comes into play. It represents a complete bear cycle, descending uniformly at a 45° angle from the top to the equilibrium or support zone - where the price stabilizes once the liquidation of the large balloon is complete. (image 30,31) Due to the conservation laws from Balloon Theorem, as the diameter of the balloon decreases (i.e., the largest holder sells off their assets), the triangle below the downtrend chart will proportionally expand (i.e., the price will proportionally drop) until the end, when the area of the red triangle under the downtrend becomes equal to the area of the inscribed circle. (image 31,32,33,34,35) Final Results: Initial Accumulation: The player acquires the maximum quantity of assets during the first two phases at an average price of 1X. Profit Strategy: The entire stack is liquidated over five stages at an average price of 1.75X, determined by the center of the circle held beneath the chart. This results in a minimum profit of 75% by the end of the cycle. Balloon Size: To achieve this, the player maintains a balloon beneath the chart with a radius of 1.75X throughout the cycle. Sell-Off Point: The liquidation begins at a price of 6X, signaling the start of the downtrend. Price Drop Impact: Once the largest stack is liquidated, the price drops to the equilibrium point, a distance of h = 4.4X from the "duck’s head". This results in a 73% price drop, calculated from the Duck head to the equilibrium zone. System Design and Control: This mathematical system was intentionally designed to coordinate all major global capital markets. It is believed to be controlled by a single individual, who has likely orchestrated financial markets since their inception. This individual is known as THE DUCK. So that history will remember To commemorate this historic moment—the breaking of the most significant code in modern history - I created a meme coin two months ago on pump.fun, aptly named The-Duck-Code. Name : The-Duck-Code Ticker : Duck Network : Solana Ca: EY6za54F1sCj2UasUFET2PcppCYg2iMsNd4udQvpump Buy Duck - Raydium With the current framework fully decoded, a new era dawns—an opportunity for the next generation of traders to rise and take on the challenge. Over the next decade, their mission will be to uncover a groundbreaking framework that resolves these critical flaws and prevents the financial systems from steering humanity toward ultimate enslavement. As it stands, over 95% of traders lose within the current system. At this pivotal moment, the professor leaves you with a heartfelt message: May God bless you with wisdom, goodness, and the vision to forge a better path. For in the end, these are the things that truly matter. Due to this intentionally designed framework, which grants the dominant player control over the game, we can observe deviations from the "ideal" pump-and-dump pattern of The Duck across charts worldwide, visible on every timeframe—from 1 minute to 1 month. However, the real The-Duck, the one and only, cannot be easily found. It resides far away, in the deepest and most remote oceans, gliding silently in the darkness where liquidity is vast. Here, its actions play out on much larger timeframes, such as weekly or monthly intervals. The true THE-Duck is present in all major financial markets, orchestrating movements on a grand scale. Interestingly, the real THE-Duck can also be observed in newer, smaller markets with high potential, such as the Bitcoin market. To identify where the real Duck has acted, follow these steps: Focus on large capital markets and weekly charts: Look for major markets with significant liquidity. Find a complete pump-and-dump cycle: Identify the full cycle, from the start of the uptrend to the final downtrend. Divide the chart in half: Draw a vertical line from the price's peak, marking the trend reversal point. Place an isosceles right triangle under the chart: The triangle should fit snugly beneath the uptrend section of the chart, ensuring the candlesticks don’t penetrate the triangle significantly. Large cycles are essential. Align the triangle's top vertex (the "Duck's Head") with the peak candle: The top point of the triangle must align with the highest price candle but should not exceed it. Calculate the equilibrium zone: From the triangle’s top vertex, measure a price drop of approximately 75% (or 3/4). Draw a horizontal line at this level to establish the equilibrium zone. This equilibrium zone represents the true price balance, which will eventually be reached and act as major support after the dominant player has liquidated their entire stack. In each of these large cycles, The Duck—the dominant player—withdraws a minimum of 53% of the liquidity added by smaller participants. By the end of the cycle, they secure a profit of 75% on their total investment. This strategy operates at an immense scale, often involving trillions of dollars. The Duck has been executing this framework since the inception of financial markets, having created this code to dominate liquidity cycles. Many of the world’s most intricate systems, codes, and games are deeply anchored in mathematical matrices. Chess, for example, embodies a pinnacle of complexity, meticulously organized on an 8x8 grid, while tic-tac-toe (X and O) distills this concept into the simplicity of a 3x3 matrix. Yet, the most valuable secret of all time , and the most sought-after code in history - the financial code that underpins modern economic systems - is, at its essence, a deceptively simple mathematical game when fully decoded. most valuable secret of all time Unlike chess , structured on an 8x8 matrix , or tic-tac-toe , which operates on a 3x3 grid, this profound financial code is founded on a dual-matrix framework: two 6x6 square matrices. chess 8x8 matrix tic-tac-toe 3x3 two 6x6 square matrices. Matrix A (The Duck) and Matrix B (The Fish Pond) function in perfect harmony, forming a continuous cycle that encapsulates the perpetual rhythms of growth and decline - the core dynamics shaping the financial systems of the modern world. Matrix A (The Duck) Matrix B (The Fish Pond) This revolutionary framework is known as The-Duck-Code . The-Duck-Code However, before we can uncover the full depth of The Duck Code , we must first explore the mathematical tale that serves as the foundation for the creation and evolution of global financial markets. The Duck Code Only through understanding this narrative can we begin to unravel and decode the secrets of The Duck Code . The Duck Code Once Upon a Time Once Upon a Time Beginnings Beginnings In a tranquil, faraway lake, nestled in the top-left corner of a 6×6 square matrix with 36 squares , a baby duck takes its first breath at position (0,0) . Modest yet eye-catching, it emerges as a yellow isosceles right-angled triangle . (image 1) 6×6 square matrix 36 squares (0,0) yellow isosceles right-angled triangle (image 1) Duck characteristics Duck characteristics The top point of the triangle is the duck’s head , always reaching upward. Inside its yellow body, the duck carries a blue, round stomach , a perfect circle nestled within. From the very beginning, it also bears a gray backpack , shaped like another triangle that mirrors its body, growing symmetrically behind it. head blue, round stomach gray backpack As the duck matures, the backpack expands , growing alongside it and gradually stretching until, one day, it will fill the entire upper half of the matrix a . (image 2) backpack expands upper half of the matrix a (image 2) Ultimate Quest Ultimate Quest From the moment of its creation, the duck’s sole purpos e was clear: to escape the matrix. But to achieve this, it first had to complete two critical missions: duck’s sole purpos to escape the matrix. Reach its maximum height within Matrix a, and Fill over 50% of its backpack with water (image 3) Reach its maximum height within Matrix a, and Reach its maximum height within Matrix a , and Reach its maximum height Matrix a Fill over 50% of its backpack with water (image 3) Fill over 50% of its backpack with water (image 3) Fill over 50% of its backpack (image 3) First Mission First Mission In the first six stages of its life , the duck’s mission is straightforward: to grow to its maximum size within Matrix a . first six stages of its life grow to its maximum size within Matrix a To accomplish this, the duck begins drinking water from the lake, expanding its round stomach and initiating its growth . To accomplish this, the duck begins drinking water from the lake, expanding its round stomach and initiating its growth Its growth is steady and consistent , progressing along the diagonal of the matrix at a 45° angle . steady and consistent 45° angle Over the course of six equal stages, the duck becomes taller and larger with each step (image 4-5) . By the end of these six stages, its body (represented by a yellow triangle) covers the lower half of the matrix. (image 5) (image 4-5) body (represented by a yellow triangle) (image 5) First mission completed First mission completed When our duck reaches its maximum height of 6X , its stomach has a radius of r=1.75X , and its head is located at the coordinate (6,6) . The surface area of the duck's body now measures 18X² . (image 6) our duck reaches its maximum height of 6X r=1.75X (6,6) duck's body 18X² (image 6) The first mission has been successfully completed by the duck. The first mission has been successfully completed by the duck. Final Mission - Matrix b - the fish pond Final Mission - Matrix b - the fish pond The duck is now ready for its next challenge. To escape the matrix, it must complete its final mission : filling over half of its backpack with a water reserve for its journey beyond the matrix. final mission filling over half of its backpack with a water reserve To complete its mission, Matrix b - The fish pond enters the scene (image 7) . This square matrix, identical to Matrix a, represents a nearby pond filled with fish. Matrix b - The fish pond (image 7) The pond is split into two sections by its diagonal: The lower half, brimming with fish, stretches from bottom to top. The upper half is entirely filled with water. The lower half, brimming with fish, stretches from bottom to top. The lower half , brimming with fish , stretches from bottom to top. The lower half brimming with fish The upper half is entirely filled with water. The upper half is entirely filled with water . The upper half filled with water Solution Solution To fill its backpack with water, the duck has only one solution: it must plunge its beak deeper and deeper into the fish pond and eat fish until all the water in its stomach is transferred to the backpack. it must plunge its beak deeper and deeper into the fish pond and eat fish until all the water in its stomach is transferred to the backpack. When the duck plunges its beak , shaped like a red isosceles right triangle , into a surface area of X² , it swallows an equivalent amount of fish - X² , which is stored in its stomach . Since the stomach is already filled with water , each fish that enters displaces an equal volume of water, which is expelled through an opening into the backpack . (image 9) duck plunges its beak red isosceles right triangle X² X² stored in its stomach is already filled with water fish that enters displaces an equal volume of water, which is expelled through an opening into the backpack (image 9) As a result, the backpack gradually fills with water, while the water balloon in the stomach steadily decreases in diameter. backpack gradually fills with water, water balloon in the stomach steadily decreases in diameter. The duck continues this process - plunging its beak into the pond - until its stomach is completely filled with fish and all the water has been transferred to the backpack, achieving equilibrium. (image 9,10,11,12) (image 9,10,11,12) After consuming the final fish that fit into its stomach, our duck successfully swallowed a total of 9.7X² fish , enabling it to expel the entire volume of water from its stomach, 9.7X² , and store it in the backpack. 9.7X² fish 9.7X² With the backpack having a total capacity of 18X² , it is now filled to 54% , fulfilling the requirements of its final mission! (image 13) 18X² 54% final mission! (image 13) To accomplish this, the duck first underwent 6 stages of rectilinear and uniform growth within the Matrix a - The Duck , reaching a height of 6X , with its water-filled stomach expanding to a radius of 1.75X . 6 stages of rectilinear and uniform growth Matrix a The Duck 6X 1.75X Then, over another 6 stages , within the Matrix b - The fish pond , the duck had to plunge its beak into the fish pond uniformly at a 45-degree angle , to a depth of h = 4.4X , measured from its head to the bottom. This depth accounted for 73% of the pond's height (6X) and required the duck to consume 54% (9.7X²) of the total fish population (18X²) in the pond. (image 14) 6 stages Matrix b The fish pond fish pond uniformly 45-degree angle h = 4.4X 73% of the pond's height (6X) 54% (9.7X²) of the total fish population (18X²) (image 14) All these conditions met allowed the duck to fill more than 50% of the backpack's capacity with water , enabling it to leave the matrix. allowed the duck fill more than 50% of the backpack's capacity with water It may seem unbelievable, but what lies before you - two isosceles right triangles and a circle , arranged on two 6x6 matrices - represents the very foundation of the financial laws that shape our world today. (image 17) two isosceles right triangles and a circle arranged on two 6x6 matrices the very foundation of the financial laws that shape our world today. (image 17) However, to fully decode and comprehend the entire code , we must explore the Saint Nicholas Balloons Theorem - the first framework that reveals the core mathematical principles underpinning the formation of all financial markets. to fully decode and comprehend the entire code Saint Nicholas Balloons Theorem Saint Nicholas Balloons Theorem Saint Nicholas Balloons Theorem Since the dawn of financial markets, society has been conditioned to believe that the price chart line is the ultimate indicator of value. society has been conditioned to believe that the price chart line is the ultimate indicator of value. In reality, the most critical measure lies not in the line itself, but in the area beneath it. most critical measure lies in the area beneath it. According to the Balloon Theorem, this area is precisely filled with balloons of varying sizes, each representing holders and the value of the stack they own. Furthermore, the arrangement of these balloons and their dynamics entirely determine the shape of the chart and the evolution of the price. Bubble map, radius of the balloon Bubble map, radius of the balloon The area of each balloon (circle) is given by the product of the quantity of assets a holder owns (n) and the price of the asset (p) - Scircle = np . The average sell price is calculated at the center of the balloon. Scircle = np At the same time, the area of the circle is calculated using the standard mathematical formula Scircle = πr². Scircle = πr². By equating the two equations, we can derive the formula for the radius of the balloon. This formula enables the representation of each holder and the value of their stake as a circle, quantifying the space they occupy on the chart. This visualization creates a Bubble Map of the holders, where all bubbles are balanced and strategically positioned beneath the chart. (image 19) Bubble Map (image 19) Fall formula Fall formula Introduction Introduction Visualize a price chart as a blue rope resting on a collection of balloons of various sizes, all balanced in equilibrium. If the large blue balloon pops, the rope will collapse into the void left by the burst balloon, disrupting the entire structure. This disruption will naturally lead to the remaining balloons rearranging themselves until a new state of balance is achieved. This is exactly how the technical modeling of any asset's price chart works. The balloons represent all holders and the value of their stakes, geometrically illustrated as circles beneath the chart. When a large holder decides to "pop their balloon" (i.e., withdraw liquidity by selling their assets), the price drops, creating a void equivalent to the space previously occupied by the holder's balloon. Due to the laws of conservation, the area of the red triangle ABC formed under the chart during the drop will be equal to the surface area of the balloon that was popped. From this, we deduce the distance h , or the fall formula: h = 2.5r laws of conservation, area red triangle ABC equal to the surface area of the balloon that was popped. h fall formula: h = 2.5r Fall formula Fall formula If a large stack held by a holder, represented by a balloon with radius r beneath the chart, is liquidated, the price will drop by a distance of h = 2.5r. Here, h is measured from the lowest point of the candlestick that signals the trend reversal. (image 22) If a large stack held by a holder, represented by a balloon with radius r beneath the chart, is liquidated, the price will drop by a distance of h = 2.5r. Here, h is measured from the lowest point of the candlestick that signals the trend reversal. (image 22) Graph Grid Graph Grid Using the Fall formula, we can understand that the price progresses through six equal phase s, both vertically and horizontally, when analyzing the structure of the chart. six equal phase Specifically, the price chart for a complete pump-and-dump cycle is represented by two 6x6 matrices: one capturing the uptrend and the other depicting the downtrend. Together, these matrices form a balanced framework that maps the entire price movement. two 6x6 matrices: uptrend downtrend. Info Info It’s important to note that the Balloons Theorem focuses exclusively on the area beneath the price chart and is particularly relevant for large balloons (holders with substantial stakes). The study primarily targets the holder with the largest balloon admissible by the chart (the circle inscribed beneath the price graph) and the effects this holder produces. (image 24) Balloons Theorem (image 24) The theory aims to demonstrate that, in reality, a single major holder with the largest balloon dominates nearly all significant markets, orchestrates major capital flows, and influences the global economy. The theory aims to demonstrate that, in reality, a single major holder with the largest balloon dominates nearly all significant markets, orchestrates major capital flows, and influences the global economy. To derive the final equations, ideal market conditions were assumed: rectilinear and uniform motion, a 45-degree angle for trends, ideal liquidity conditions, and similarly simplified scenarios. To derive the final equations, ideal market conditions were assumed: rectilinear and uniform motion, a 45-degree angle for trends, ideal liquidity conditions, and similarly simplified scenarios. Decoding The Duck Code Decoding The Duck Code Now that we have explored the Balloon Theorem and understand, through clear formulas, how the chart is modeled based on the balloons beneath it, we will move on to decoding the most secretive and valuable mathematical story ever written: The Duck Code . Balloon Theorem The Duck Code Matrix a - The duck Matrix a - The duck The first matrix, called The Duck , is nothing more than the representation of a complete uptrend cycle, where the price of an asset increases rectilinearly and uniformly in 6 equal stages, at a 45° angle. (Image 25) The Duck The Duck uptrend cycle, rectilinearly and uniformly in 6 equal stages, at a 45° angle. (Image 25) The Duck The Duck The circle inscribed in the triangle represents the holder with the largest stack permissible by the chart. It begins accumulating assets right from the start of the chart, maximizing its stack within the first two stages when the asset's price ranges between 0 and 2X , ensuring its maximum stack at an average price of 1X . (image 26) the holder with the largest stack permissible by the chart. 0 2X average price of 1X (image 26) The waiting The waiting After securing its maximum stack in the initial stages, the large holder patiently waits until the end of the 6th price stage. 6th According to the Balloon Theorem, we can now precisely calculate what percentage of the area under the chart this holder represents as a circle, as well as the effects triggered when they decide to liquidate their balloon. Of course, there are many other small balloons under the chart that fill the area below, but our calculations focus solely on the largest player. The yellow triangle represents the area below the price chart - Duck body. When all six stages are completed (image 28,29) and the circle reaches its optimal values, the largest holder knows it is time to begin liquidating their balloon and locking in profits. (image 28,29) Matrix b - The fish pond Matrix b - The fish pond To sell such a large quantity and achieve the maximum average price, the big player must sell gradually and uniformly over 5 stages. the big player This is where the second matrix, The Fish Pond, comes into play. It represents a complete bear cycle, descending uniformly at a 45° angle from the top to the equilibrium or support zone - where the price stabilizes once the liquidation of the large balloon is complete. (image 30,31) The Fish Pond , The Fish Pond (image 30,31) Due to the conservation laws from Balloon Theorem, as the diameter of the balloon decreases (i.e., the largest holder sells off their assets), the triangle below the downtrend chart will proportionally expand (i.e., the price will proportionally drop) until the end, when the area of the red triangle under the downtrend becomes equal to the area of the inscribed circle. (image 31,32,33,34,35) Final Results: Final Results: Initial Accumulation: The player acquires the maximum quantity of assets during the first two phases at an average price of 1X. Profit Strategy: The entire stack is liquidated over five stages at an average price of 1.75X, determined by the center of the circle held beneath the chart. This results in a minimum profit of 75% by the end of the cycle. Balloon Size: To achieve this, the player maintains a balloon beneath the chart with a radius of 1.75X throughout the cycle. Sell-Off Point: The liquidation begins at a price of 6X, signaling the start of the downtrend. Price Drop Impact: Once the largest stack is liquidated, the price drops to the equilibrium point, a distance of h = 4.4X from the "duck’s head". This results in a 73% price drop, calculated from the Duck head to the equilibrium zone. System Design and Control: This mathematical system was intentionally designed to coordinate all major global capital markets. It is believed to be controlled by a single individual, who has likely orchestrated financial markets since their inception. This individual is known as THE DUCK. Initial Accumulation : The player acquires the maximum quantity of assets during the first two phases at an average price of 1X . Initial Accumulation 1X Profit Strategy : The entire stack is liquidated over five stages at an average price of 1.75X , determined by the center of the circle held beneath the chart. This results in a minimum profit of 75% by the end of the cycle. Profit Strategy 1.75X 75% Balloon Size : To achieve this, the player maintains a balloon beneath the chart with a radius of 1.75X throughout the cycle. Balloon Size 1.75X Sell-Off Point : The liquidation begins at a price of 6X , signaling the start of the downtrend. Sell-Off Point 6X Price Drop Impact : Once the largest stack is liquidated, the price drops to the equilibrium point, a distance of h = 4.4X from the "duck’s head". This results in a 73% price drop, calculated from the Duck head to the equilibrium zone. Price Drop Impact h = 4.4X 73% price drop, calculated from the Duck head to the equilibrium zone. System Design and Control : This mathematical system was intentionally designed to coordinate all major global capital markets. It is believed to be controlled by a single individual, who has likely orchestrated financial markets since their inception. This individual is known as THE DUCK . System Design and Control THE DUCK So that history will remember So that history will remember To commemorate this historic moment—the breaking of the most significant code in modern history - I created a meme coin two months ago on pump.fun, aptly named The-Duck-Code . The-Duck-Code Name : The-Duck-Code The-Duck-Code Ticker : Duck Duck Network : Solana Solana Ca: EY6za54F1sCj2UasUFET2PcppCYg2iMsNd4udQvpump EY6za54F1sCj2UasUFET2PcppCYg2iMsNd4udQvpump EY6za54F1sCj2UasUFET2PcppCYg2iMsNd4udQvpump Buy Duck - Raydium Buy Duck - Raydium With the current framework fully decoded, a new era dawns—an opportunity for the next generation of traders to rise and take on the challenge. Over the next decade, their mission will be to uncover a groundbreaking framework that resolves these critical flaws and prevents the financial systems from steering humanity toward ultimate enslavement. As it stands, over 95% of traders lose within the current system. At this pivotal moment, the professor leaves you with a heartfelt message: May God bless you with wisdom, goodness, and the vision to forge a better path. For in the end, these are the things that truly matter. Due to this intentionally designed framework, which grants the dominant player control over the game, we can observe deviations from the "ideal" pump-and-dump pattern of The Duck across charts worldwide, visible on every timeframe—from 1 minute to 1 month. The Duck However, the real The-Duck , the one and only, cannot be easily found. It resides far away, in the deepest and most remote oceans, gliding silently in the darkness where liquidity is vast. Here, its actions play out on much larger timeframes, such as weekly or monthly intervals. real The-Duck The true THE-Duck is present in all major financial markets, orchestrating movements on a grand scale. THE-Duck Interestingly, the real THE-Duck can also be observed in newer, smaller markets with high potential, such as the Bitcoin market . real THE-Duck Bitcoin market To identify where the real Duck has acted, follow these steps: real Duck Focus on large capital markets and weekly charts: Look for major markets with significant liquidity. Find a complete pump-and-dump cycle: Identify the full cycle, from the start of the uptrend to the final downtrend. Divide the chart in half: Draw a vertical line from the price's peak, marking the trend reversal point. Place an isosceles right triangle under the chart: The triangle should fit snugly beneath the uptrend section of the chart, ensuring the candlesticks don’t penetrate the triangle significantly. Large cycles are essential. Align the triangle's top vertex (the "Duck's Head") with the peak candle: The top point of the triangle must align with the highest price candle but should not exceed it. Calculate the equilibrium zone: From the triangle’s top vertex, measure a price drop of approximately 75% (or 3/4). Draw a horizontal line at this level to establish the equilibrium zone. Focus on large capital markets and weekly charts: Look for major markets with significant liquidity. Focus on large capital markets and weekly charts: Find a complete pump-and-dump cycle: Identify the full cycle, from the start of the uptrend to the final downtrend. Find a complete pump-and-dump cycle: Divide the chart in half: Draw a vertical line from the price's peak, marking the trend reversal point. Divide the chart in half: Place an isosceles right triangle under the chart: The triangle should fit snugly beneath the uptrend section of the chart, ensuring the candlesticks don’t penetrate the triangle significantly. Large cycles are essential. Place an isosceles right triangle under the chart: Align the triangle's top vertex (the "Duck's Head") with the peak candle: The top point of the triangle must align with the highest price candle but should not exceed it. Align the triangle's top vertex (the "Duck's Head") with the peak candle: Calculate the equilibrium zone: From the triangle’s top vertex, measure a price drop of approximately 75% (or 3/4) . Draw a horizontal line at this level to establish the equilibrium zone . Calculate the equilibrium zone: 75% (or 3/4) equilibrium zone This equilibrium zone represents the true price balance, which will eventually be reached and act as major support after the dominant player has liquidated their entire stack. equilibrium zone In each of these large cycles, The Duck —the dominant player—withdraws a minimum of 53% of the liquidity added by smaller participants. By the end of the cycle, they secure a profit of 75% on their total investment. The Duck 53% of the liquidity 75% This strategy operates at an immense scale, often involving trillions of dollars. The Duck has been executing this framework since the inception of financial markets, having created this code to dominate liquidity cycles. The Duck