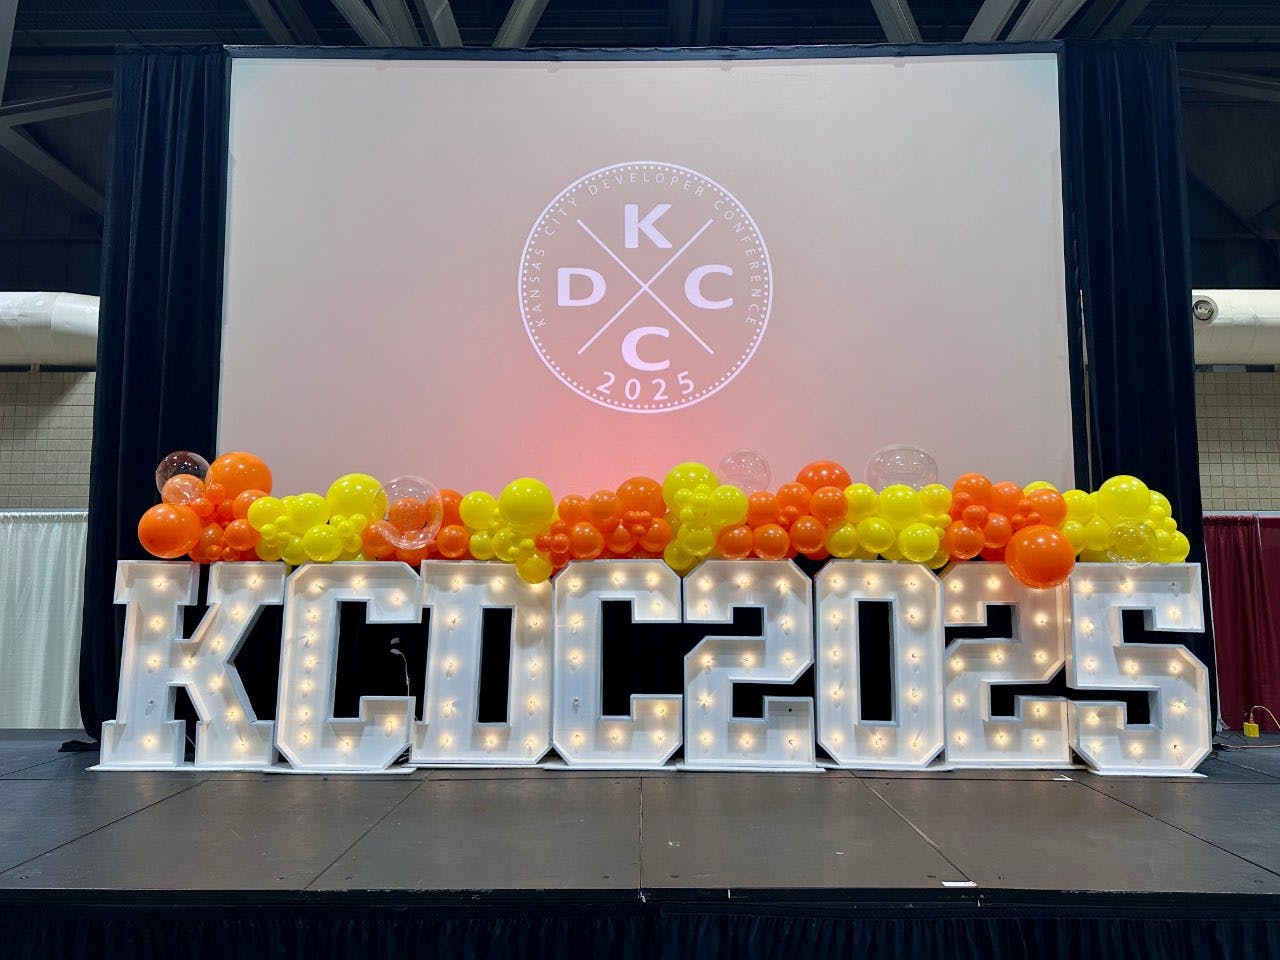
Tech Stories


Listen to the Podcast on
Top Tech Stories Writers
#1

Yogurt Chiang
@yogurt67Chien Hui Chiang (known as Yogurt) is a Lead Image Engineer and digital imaging specialist in digita...
4 recent stories
#2

superorange0707
@superorange0707AI/ML engineer blending fuzzy logic, ethical desig...
2 recent stories
#3

Nick Maletsky
@nickztSenior Software Engineer, technology geek, prefers cats...
2 recent stories
#4

sarahevans
@sarahevansCommunications Strategist & Technology Builder 🔮 Partner Zen Media | ...
2 recent stories
#5

KoKyat
@yogurt67...
2 recent stories


Popular Tech Stories Topics
#hackernoon-top-story#technology#latest-tech-stories#tech#chainwire#latest-tect-stories#technology-trends#tech-careers#women-in-tech#btcwire#scientific-and-technical#various#tech-beat#legalpdf#web#open-source-software#tech-interviews#healthtech#scientific-american#tech-twitter-thread#email#infrastructure#search-engine#healthcare-tech#online-shopping#windows#iphone#entertainment#telegram#youtube-transcripts#accessibility#military-philosophy#tech-jobs#tech-awards#carl-von-clausewitz#on-war#job-search#philosophical-fiction#smartphones#enterprise-technology#online-courses#tech-newsletters#trending-technology-companies#elizabeth-cleghorn-gaskell#startups-of-the-year-2023#k8s#techsoup#information-technology#scientific-american-supplement#collaboration#young-adult-fiction#digital#big-tech#tech-trends#tech-events#top-sci-fi-books#speeches#tech-stories#search#the-way-we-live-now#conversion-optimization#social-novel#iot-applications#john-locke#suspense#2020#google-search#meta-lawsuit#sports#video-streaming#archibald-williams#digital-advertising#ceo#employee-engagement#hardware-review


![Tech Media Bias [Research Publication]](https://hackernoon.imgix.net/images/frRB2u5KPDWNFTREWk4zW42RJ5w1-su831oj.jpeg?auto=format&fit=max&w=96)


![Tensor Flow - [Technical Documentation]](https://hackernoon.imgix.net/images/undefined-q683u5r.jpeg?auto=format&fit=max&w=96)