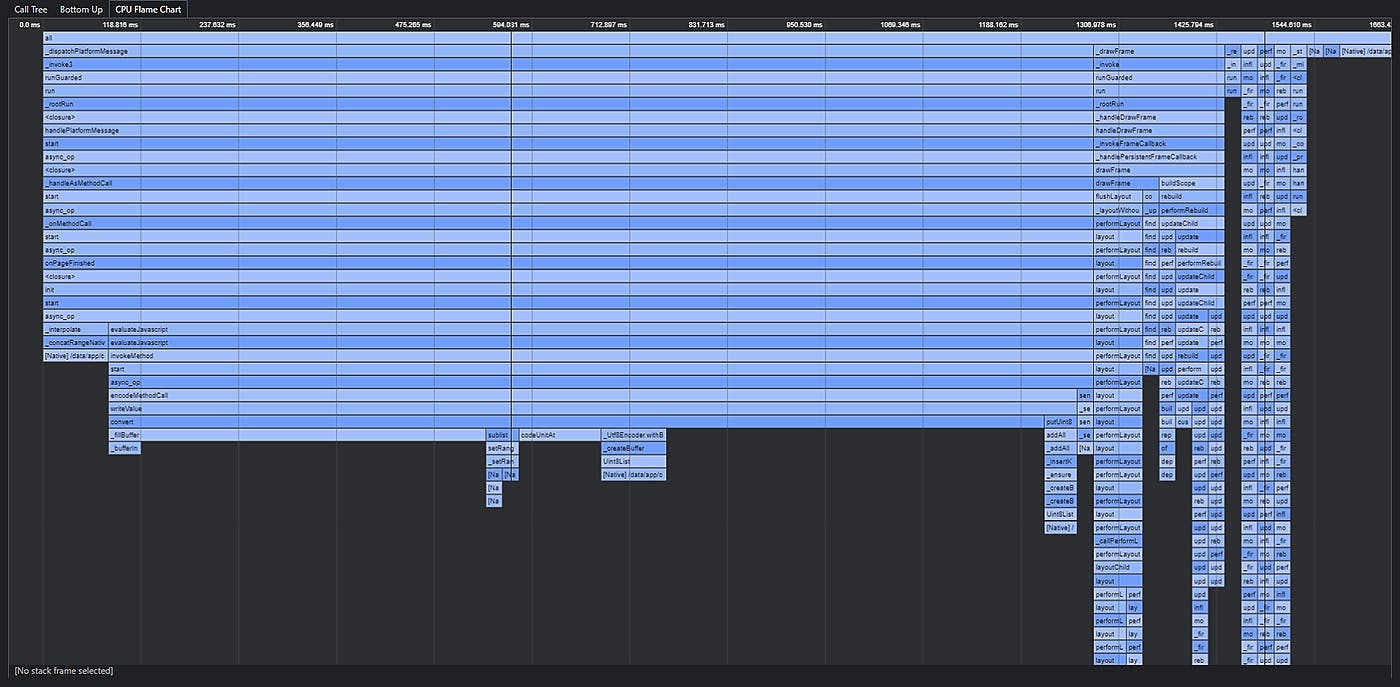
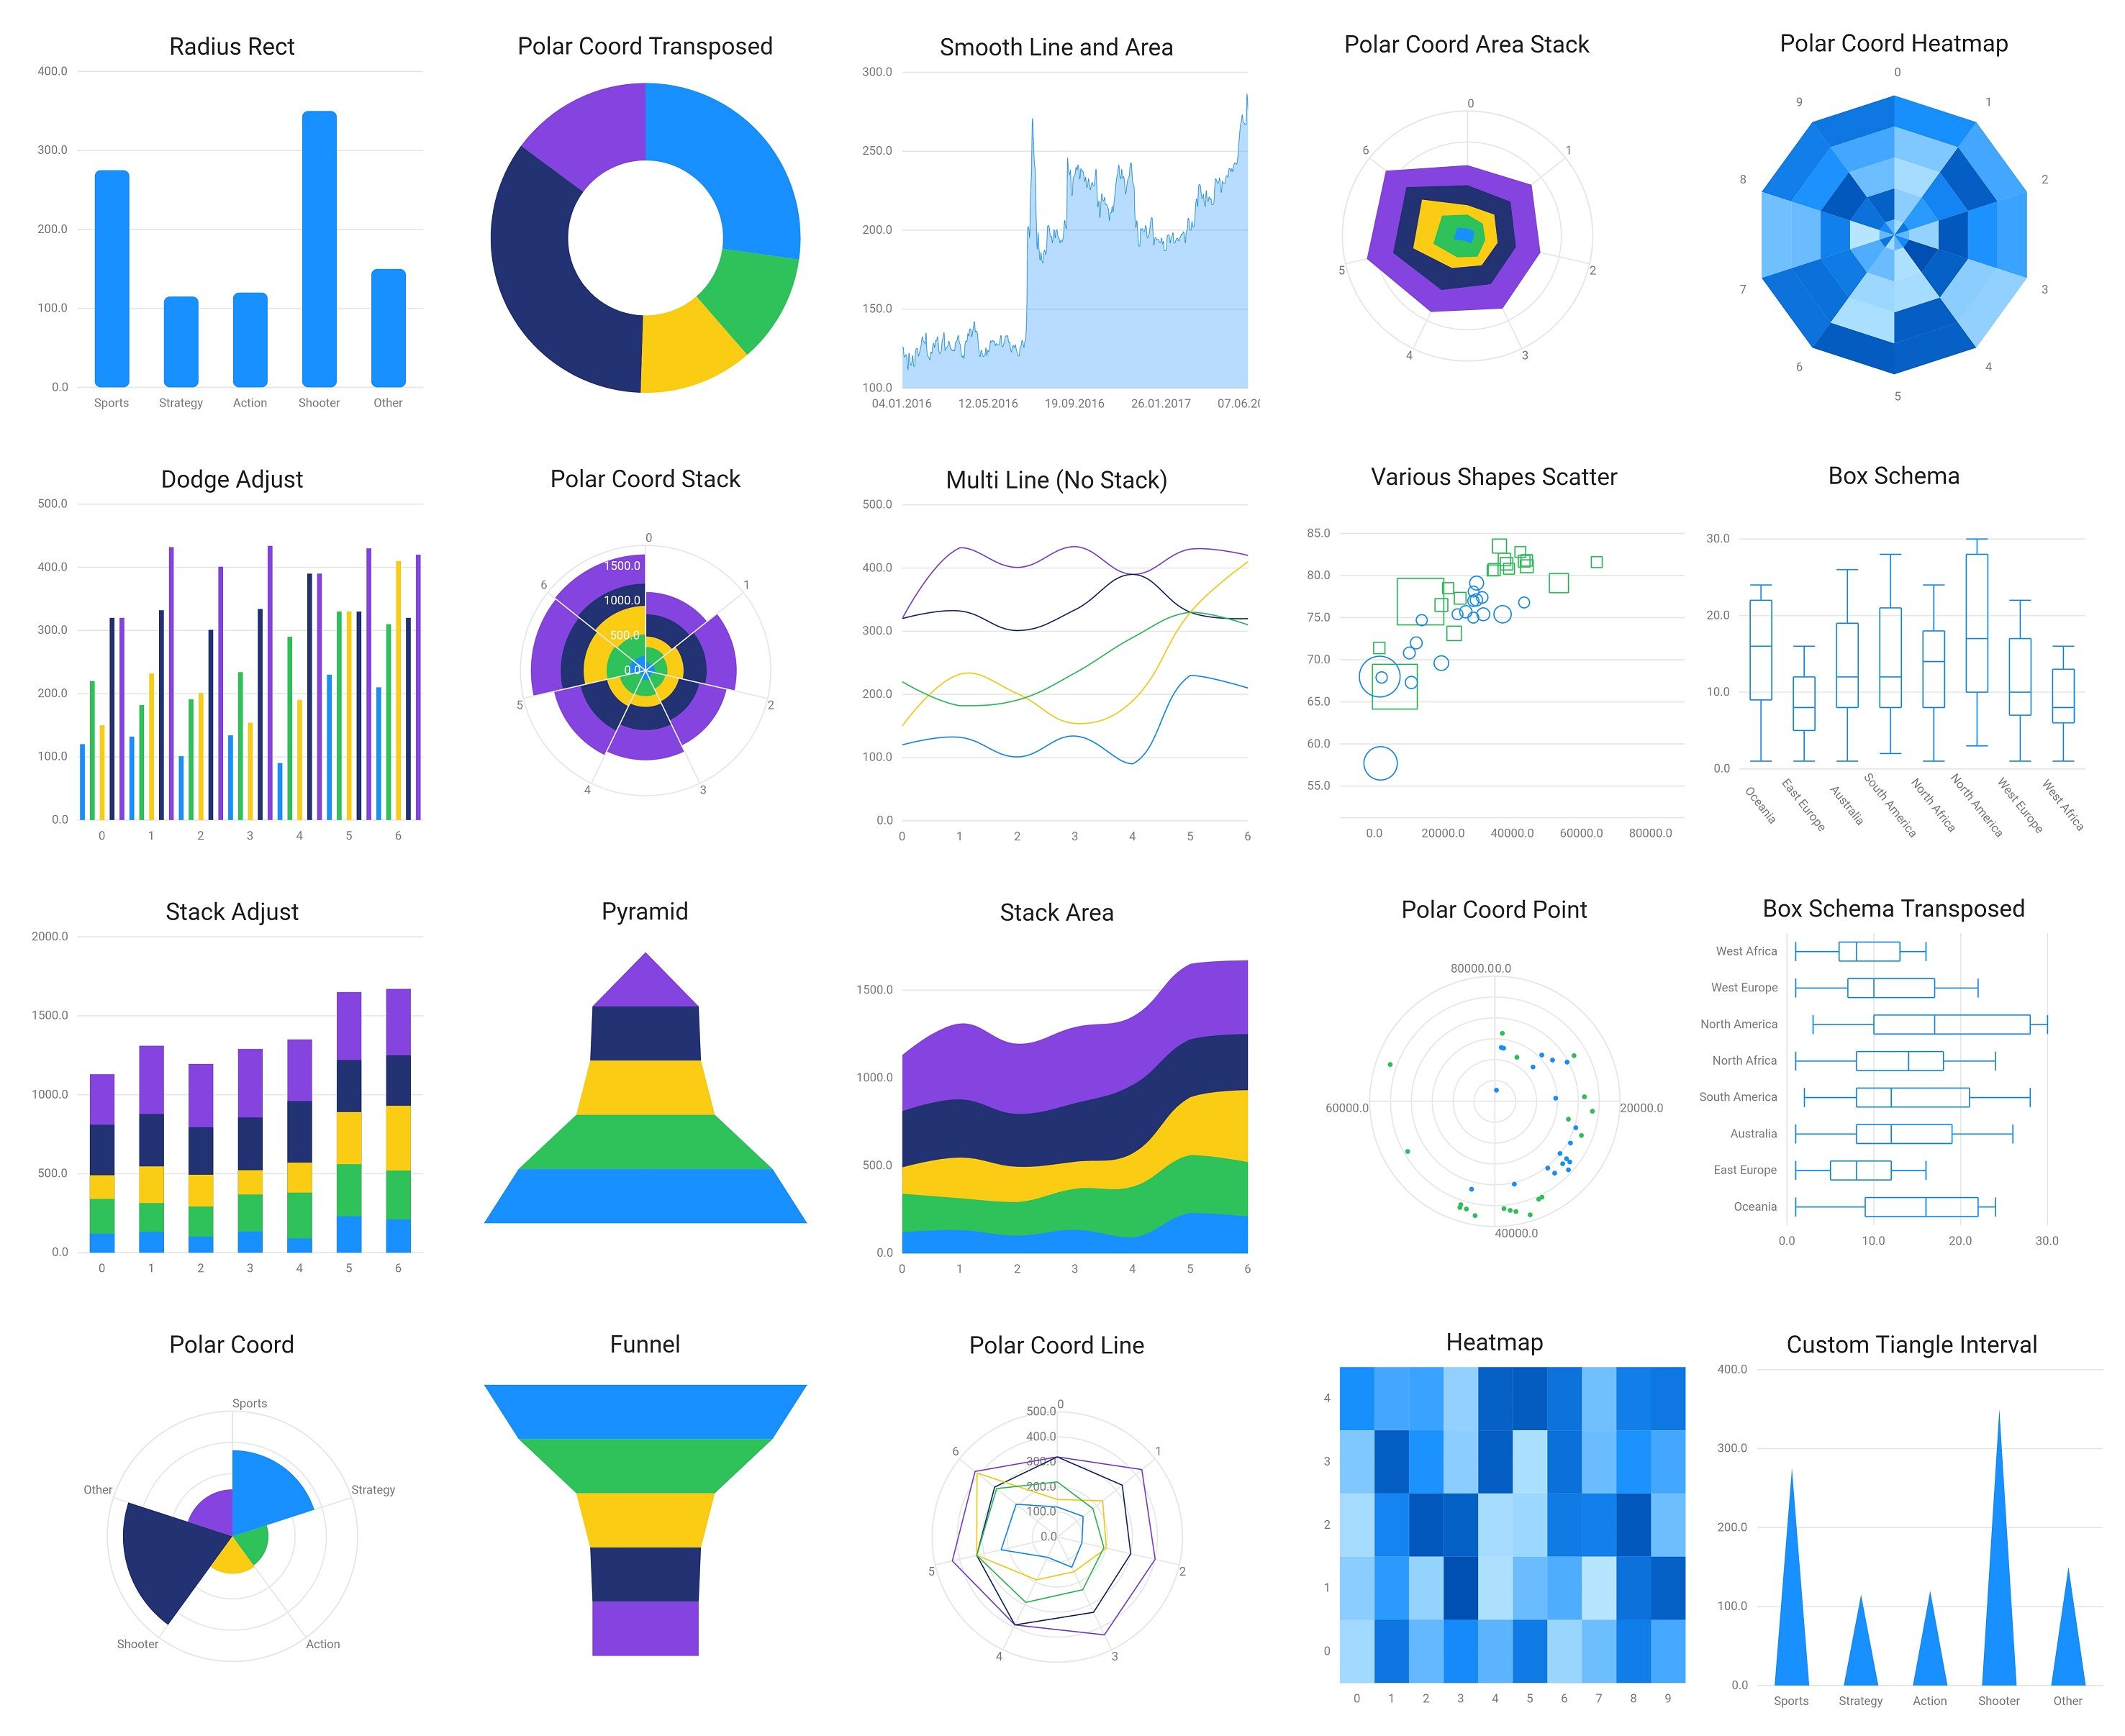
This article records a performance optimization of the WebView based Flutter data visualization library: . echarts_flutter For any widgets based on WebView, the loading of pages is always a crucial part of performance. , whose foundation is to render local pages of with WebView, is no exception. echarts_flutter echarts The contents to load of can be divided into these parts: echarts_flutter template HTML echarts script echarts extension scripts logic code of the chart The template HTML and the logic code of the chart is rather small, so the key point is the loading of echarts script and echarts extension scripts. One of echarts' best features is that it has many awesome extensions, such as WebGL 3D charts, GIS maps, etc. As data visualization requirements getting more and more complex, these extensions have become no less important than echarts itself. So it is a must to allow users to import extensions conveniently. Besides, to avoid troublesome assets management, we hope to handle both HTML and JavaScript as strings, thus the WebView will load all sources as URI. There would be some questions: Should the scripts be inside the HTML or injected afterwards? The URI has some char limits, it needs a safe encoding form. Original Approach In the beginning, we thought that, in general idea, we'd better put all things in the HTML and load them together. Considering there are a lot of illegal URI chars in JavaScript, we should convert the HTML into Base64 after composing. For we don't know what extension scripts the user will import, the encoding will be executed by functions dynamically: _getHtml( echartsScript, List< > extensions, extraScript, ) { ... } @override initState() { .initState(); _htmlBase64 = + base64Encode( Utf8Encoder().convert(_getHtml( echartsScript, widget.extensions ?? [], widget.extraScript ?? , )) ); _currentOption = widget.option; } @override Widget build(BuildContext context) { WebView( initialUrl: _htmlBase64, ... ); } String String String String // Compose and return all HTML and scripts void super // Convert to Base64 in init 'data:text/html;base64,' const '' return // Load all of them Performance Test Let's take a simple performance test for feather analyses. The test case has three charts, including a WebGL 3D chart and a liquid animation chart: With the Flutter Dev Tool, we can get the flame chart of CPU time occupation: Optimization Echarts and it's extensions are of large volumes. So it will take a lot of time to compose and convert the strings in runtime. But these are necessary steps to get legal URI strings, so how to solve this problem? How about abandon the idea "load everything together", and inject the dynamic part by evaluateJavascript and only put the static part in HTML? this may save some converting work. To make sure of the feasibility, let's take an experiment first: only move out all scripts from HTML and inject them with evaluateJavascript, and check the performance: @override initState() { .initState(); _htmlBase64 = + base64Encode( Utf8Encoder().convert(_getHtml( )) ); _currentOption = widget.option; } init() { final extensionsStr = .widget.extensions.length > ? .widget.extensions.reduce( (value ?? ) + + (element ?? ) ) : ; _controller?.evaluateJavascript( chart ); } void super 'data:text/html;base64,' const // remove all scripts form the convert function // echartsScript, // widget.extensions ?? [], // widget.extraScript ?? '', void async this 0 this ( ) => value, element '' '\n' '' '' await '' ' // inject after the page is loaded $echartsScript $extensionsStr const chart = echarts.init(document.getElementById(' '), null); ${this.widget.extraScript} chart.setOption($_currentOption, true); ' '' The result is: We can see that the time of loading HTML is reduced, while the time of onPageFinished, which contains the injection of scripts grew. The total time is reduced. So it seems that converting large strings is quite costing. Using evaluateJavascript instead is a right way. So we then remove all the dynamic converting part, and load template HTML as a const string. Since the HTML is static and short now, we can escape the illegal chars manually and input UTF-8 string directly, which needs no dart:convert library and looks more plain: htmlUtf8 = ; @override initState() { .initState(); _currentOption = widget.option; } @override Widget build(BuildContext context) { WebView( initialUrl: htmlUtf8, ... ); } const 'data:text/html;UTF-8,<!DOCTYPE html><html><head><meta charset="utf-8"><style type="text/css">body,html,%23chart{height: 100%;width: 100%;margin: 0px;}div {-webkit-tap-highlight-color:rgba(255,255,255,0);}</style></head><body><div id="chart" /></body></html>' void super return The test result is: We can see that time is further reduced, especially in loading. Thus, compared to the original version, the performance improved a lot. Echarts script is also static, what if we convert it previously and put it in the HTML: echartsHtmlBase64 = ; @override Widget build(BuildContext context) { WebView( initialUrl: echartsHtmlBase64, ... ); } const '...' return The result is: On the contrary, it takes more time. So we can see that "putting scripts in HTML" is not necessarily better than "injecting by evaluateJavascript", and even takes more time for some encoding reasons. Conclusion In summary, the final optimization solution is: load template HTML in UTF-8 URI string and inject all scripts and logic code with evaluateJavascript . Note: the webview_flutter has an issue that onPageFinished won't work in IOS, so the optimization above has not applied to release version for now. You can see the source code of it in this commit . Previously published at https://levelup.gitconnected.com/a-performance-optimization-of-flutter-webview-6afa1a5b4300