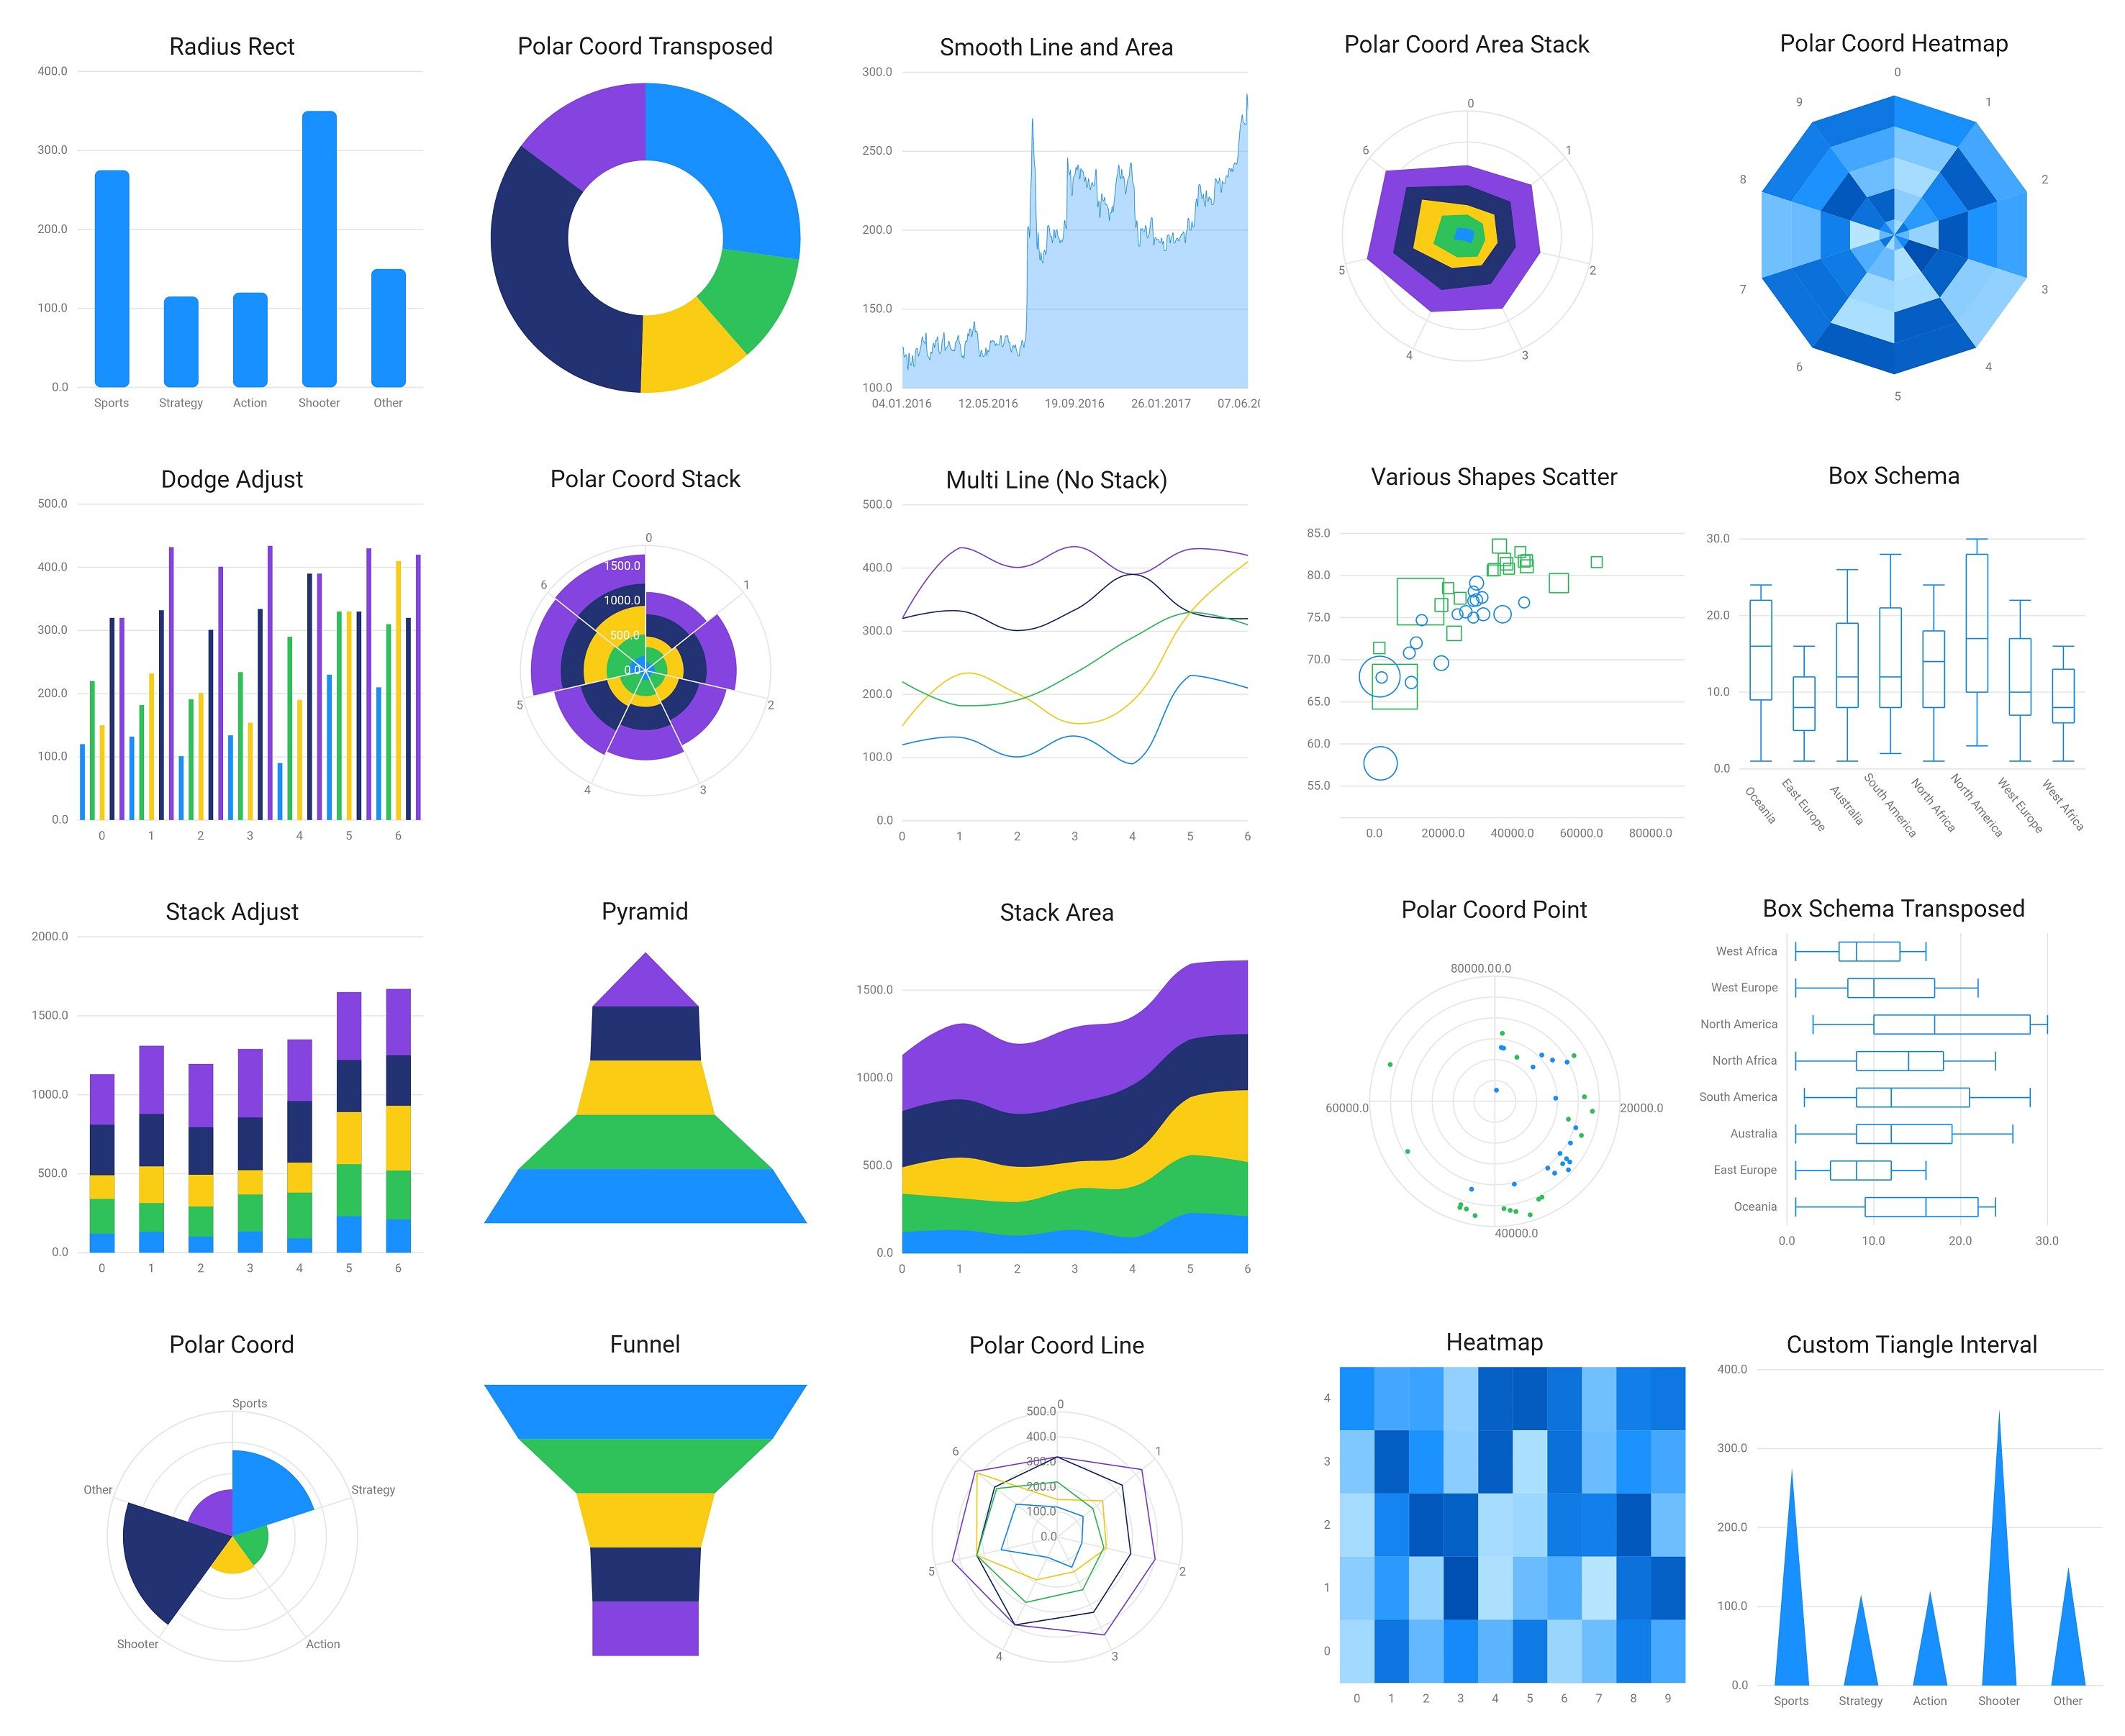
Data visualization is a common but important part of application development. A good visualization library always makes it easier to build data visualization charts. But unfortunately, there is not yet a perfect visualization library in the Flutter community. The current candidates all have some unsatisfactoriness, such as: is developed by Google, and has very fine code quality. But it provides very limited chart categories. It lacks some commonly used features like smooth lines. Besides, it seems to be an experimental projects witch has no documents or manuals. Although it's code is uploaded to GitHub, it is not open to any issue or PR. It has no new features updated for a long time. charts_flutter is the most popular visualization library on pub.dev. It has cool designs and animations. It is developed by an . But it has too much personal style for some statistics or serious situations. fl_chart Iran handsome is very complete and professional. But it's a commercial product and not open sourced. It needs paid licenses. That's not suitable for many developers. syncfusion_flutter_charts To build complex visualization charts, we developed , Witch imports Echarts (A powerful Web visualization library) into Flutter Apps by Webview. It did help to satisfy some complex demands, but Webview has some weaknesses in performance and compatibility. For fluency and stability, we still need a native Flutter data visualization library. flutter_echarts In recent years, data visualization in front-end development has progressed a lot. The Grammar of Graphics theory has been applied to web visualization libraries. this theory is proposed by Leland Wilkinson in the book . It tries to describe grammar rules for all statistic graphics. The Grammar of Graphics Thanks to this theory, the visualization library will no longer be limited to the traditional charts categories like line/bar/pie. Data visualization is abstracted to a combination of geometry marks, coordinates, and scales, which highly increased flexibility and extensibility. Frontend visualization libraries based on Grammar of Graphics are , of Alipay, and of Microsoft. vega AntV chart-part So, there comes : a Flutter data visualization library based on Grammar of Graphics. Graphic Example A basic example of Graphic: graphic.Chart( data: [ { : , : }, { : , : }, { : , : }, { : , : }, { : , : }, ], scales: { : graphic.CatScale( accessor: (map) => map[ ] , ), : graphic.NumScale( accessor: (map) => map[ ] , nice: , ) }, geoms: [graphic.IntervalGeom( position: graphic.PositionAttr(field: ), shape: graphic.ShapeAttr(values: [ graphic.Shapes.rrectInterval(radius: Radius.circular( )) ]), )], axes: { : graphic.Defaults.horizontalAxis, : graphic.Defaults.verticalAxis, }, ) 'genre' 'Sports' 'sold' 275 'genre' 'Strategy' 'sold' 115 'genre' 'Action' 'sold' 120 'genre' 'Shooter' 'sold' 350 'genre' 'Other' 'sold' 150 'genre' 'genre' as String 'sold' 'sold' as num true 'genre*sold' 5 'genre' 'sold' More examples please see in this : Example App Features Grammar of Graphics Data visualization can be roughly summarized to: Mapping data to visual channel attribute (color, shape, size, position...) values by a certain rule, and then render shapes with these attributes. In Grammar of Graphics, this progress can be concrete to: In Graphic, the design of APIs and class names are mainly refered to AntV. The core concepts are: : Geometry marks, or shapes to compose the chart. Geom : Coordinates of the chart, including two types: Cartesian and Polar. Coord : Rules to scale data into [0, 1], for the usage to map to visual channel attributes. Scale : Visual channel attributes, including color, shape, size, position... The value is decided by scaled data. they are applied to geometry marks. Attr These concepts are familiar for those who has already known about Grammar of Graphics. If you have never met them, please refer to the book. We think that Grammar of Graphics is an important part of data visualization, so whether you will use related libraries or not, it worth learning. Declarative Chart Most visualization libraries in Web is imperative, and plot charts by calling a series of functions. AntV is not an exception. But in Flutter, declarative and reactive views are advocated. The constructor of view is configured by the tree returned in build function. It's worth mentioning that this is also an important deference between Web Canvas and Flutter CustomPaint Widget. So Graphic APIs is designed declarative. All information is configured by props of graphic. Chart Widget. The chart will rerender when the widget tree updates. By the way, we will optimize the rerender performance in the future. Custom Shape Why there can be all kinds of various charts? The key is the diversity of shape attribute. So it is the most complex one in all visual channel attributes. The customizability of shape attribute determines the extensibility of visualization libraries. In Graphic, the shape attribute is defined to functions or high order functions. It receives values of visual channel attributes of geometry marks, and returns the composed render shapes for the render engine. Users can custom their own shape functions: <graphic.RenderShape> triangleInterval( <graphic.AttrValueRecord> attrValueRecords, graphic.CoordComponent coord, Offset origin, ) { } List List // Implementation of attrValueRecords => renderShapes TO DO Graphic has now mainly finished static charts. We will add features such as interactions, animations, and components like tooltip, legend in the future. The features and APIs may be unstable for now. So you are welcome for trial, but be cautious to use it in production environment. In this article we introduced a Flutter data visualization library based on Grammar of Graphics: Graphic Repository pub.dev Previously published behind a paywall: https://medium.com/@entronad/graphic-a-flutter-data-visualization-library-base-on-grammar-of-graphics-75ca751f5cae