What affects developer decision making, how open source is getting faster, and why you should track the mean time to update to build software that lasts.
When choosing the right open-source software, we often consider the health of the project by the longevity of the community and the stability of their most recent releases. Some of the most common best practices are visualized below:
All of these help to steer towards the right choice for software architecture. The problem is, these decision-making practices tend to break down or get muddled when you look at the reality of maintaining a micro-service infrastructure where I have to decide on both the right component AND the right version in order to ensure I’m building something that’s stable and secure. This is the part of the story we leave out too often when we design software architecture: the fact that even the best components decay.
The average application contains 128 open source dependencies, and developers must constantly decide when (and when not to) update third-party dependencies inside of their applications. A review of 100,000 applications and more than 4,000,000 component migrations (upgrades) found that the majority were suboptimal.
While there are several metrics that attempt to assess the health of open source components, these do not provide strong metrics for the up-to-date health and security of those components, relying heavily on other contributing factors like community usage or project documentation.
For example, Libraries.io Sourcerank aims to measure the quality of software with a focus on project documentation, maturity, and community into a single score (usually from 1-30, higher being a good indicator of project health).
There are other great examples where the evaluation of the project understands that the system is only as strong as the people who support it. OpenSSF Criticality also measures a project's community, usage, and activity, distilling it into a score that is intended to measure how critical the project is to the open-source ecosystem.
These metrics are incredibly helpful for making the right decisions around which open source components can be brought into your architecture, but they do not offer insights that directly represent the growing and accelerating landscape of versioning control in Open Source.
Above is an example of a single project’s versioning history and the behavior of the global developer community as they aim to choose the optimal versions. Although it’s common best practice in software development, our research findings found that, on average, the optimal version to choose is typically 2.7 versions back from the latest “bleeding edge” release, likely because they’ve been accessed and updated for security vulnerabilities.
This is a new metric optimized for the true measure of project quality that is based on how quickly the project moves to update dependencies. MTTU doesn’t directly measure the speed at which projects fix publicly disclosed vulnerabilities, but it strongly correlates to a project’s Mean Time to Remediate (MTTR), which is the time required to update dependencies that have published vulnerabilities.
MTTU essentially gives us a metric to determine the impact a component will have on the security of projects that incorporate it, making measurable the tricky question of when an open source will be a lemon or a stable pillar of a software’s architecture.
For any Component:
Examine all versions of dependencies
1. Calculate the time between when that version was released
2. Calculate when Component A releases a new version with the dependency update
Lower (faster) is better: components that react slowly or have high variance in their update times will have higher MTTU.
With MTTU in hand, we can get a very good proxy of the health of an open-source project by showing the artificial ‘immune system’ of the open-source community around it when vulnerabilities are quickly patched by the project maintainers.
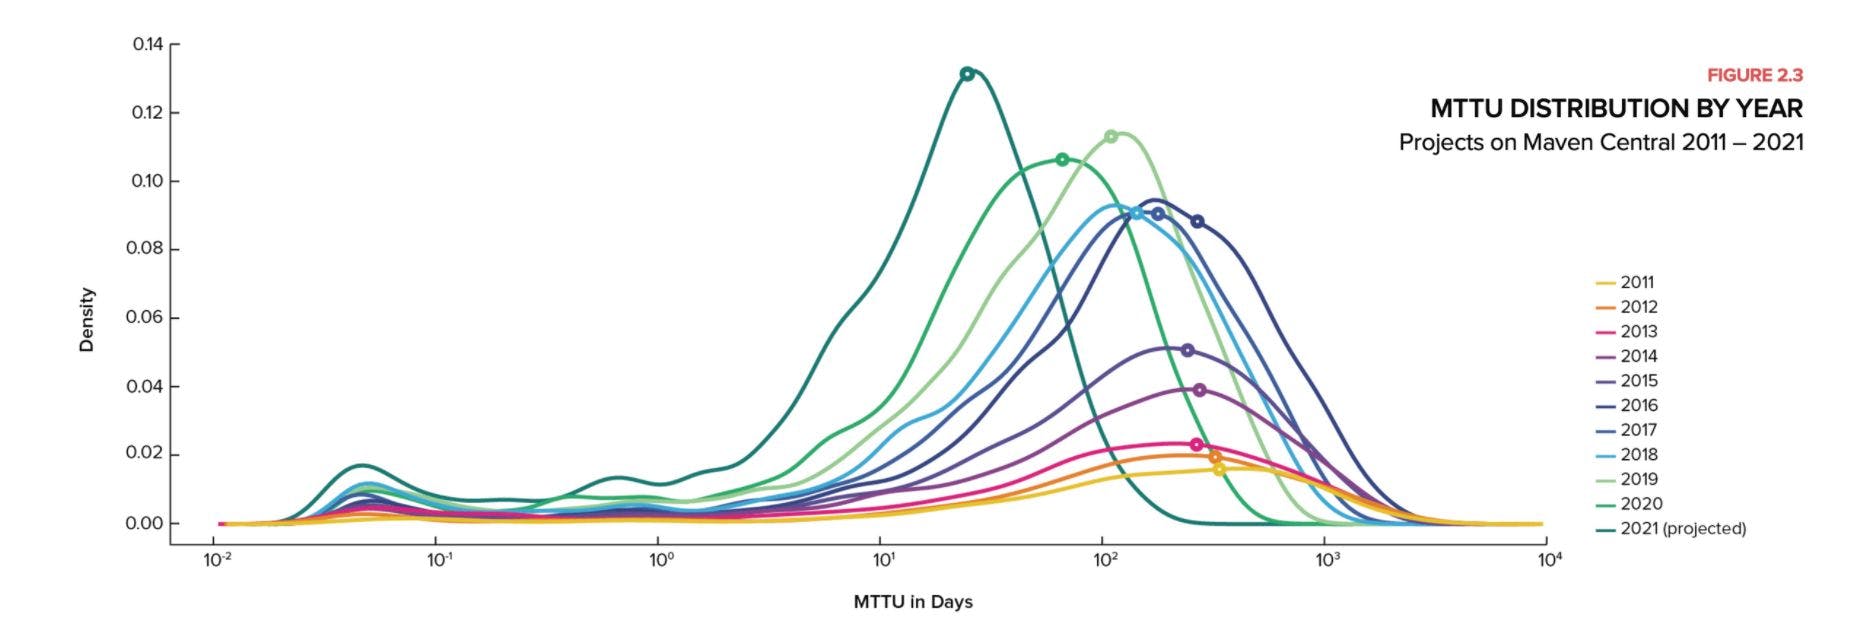
Perhaps not surprisingly, our analysis of the last 10 years of open source contributions found that the mean time to update across most projects has rapidly accelerated.
The average MTTU across projects in Maven Central Repository in 2011 was 371 days; by 2018, it was 158 days; and in 2021, the average MTTU was 28 days – less half of the 73 days the average project took in 2020.
A combination of tooling, automation, and a growing awareness of the next generation cybersecurity in open source all play a role in this acceleration. Automated analysis of best-choice versioning is essential to keeping pace with the open-source supply chain.
The attack surface area of an open-source project grows with the contributions it receives, and as many of us contribute new features to a project. This is a uniquely open source problem that can be solved if we bring together the biggest open source projects in major ecosystems like Kubernetes, Python, or Java and help their developer communities to give back through a gamified clean-up of their vulnerabilities - and improving their MTTU.
If you have a special love for Golang or Rust and want to learn more about how to reduce those vulnerabilities, consider joining online for the next CNCF+Sonatype KubeCon Bug Bash in October 2021.
Below are the Kubernetes open-source projects in the next bash!
Harbor Keptn Meshery Kyverno KubeVela Longhorn Chaos Mesh TiKV Serverless Workflow