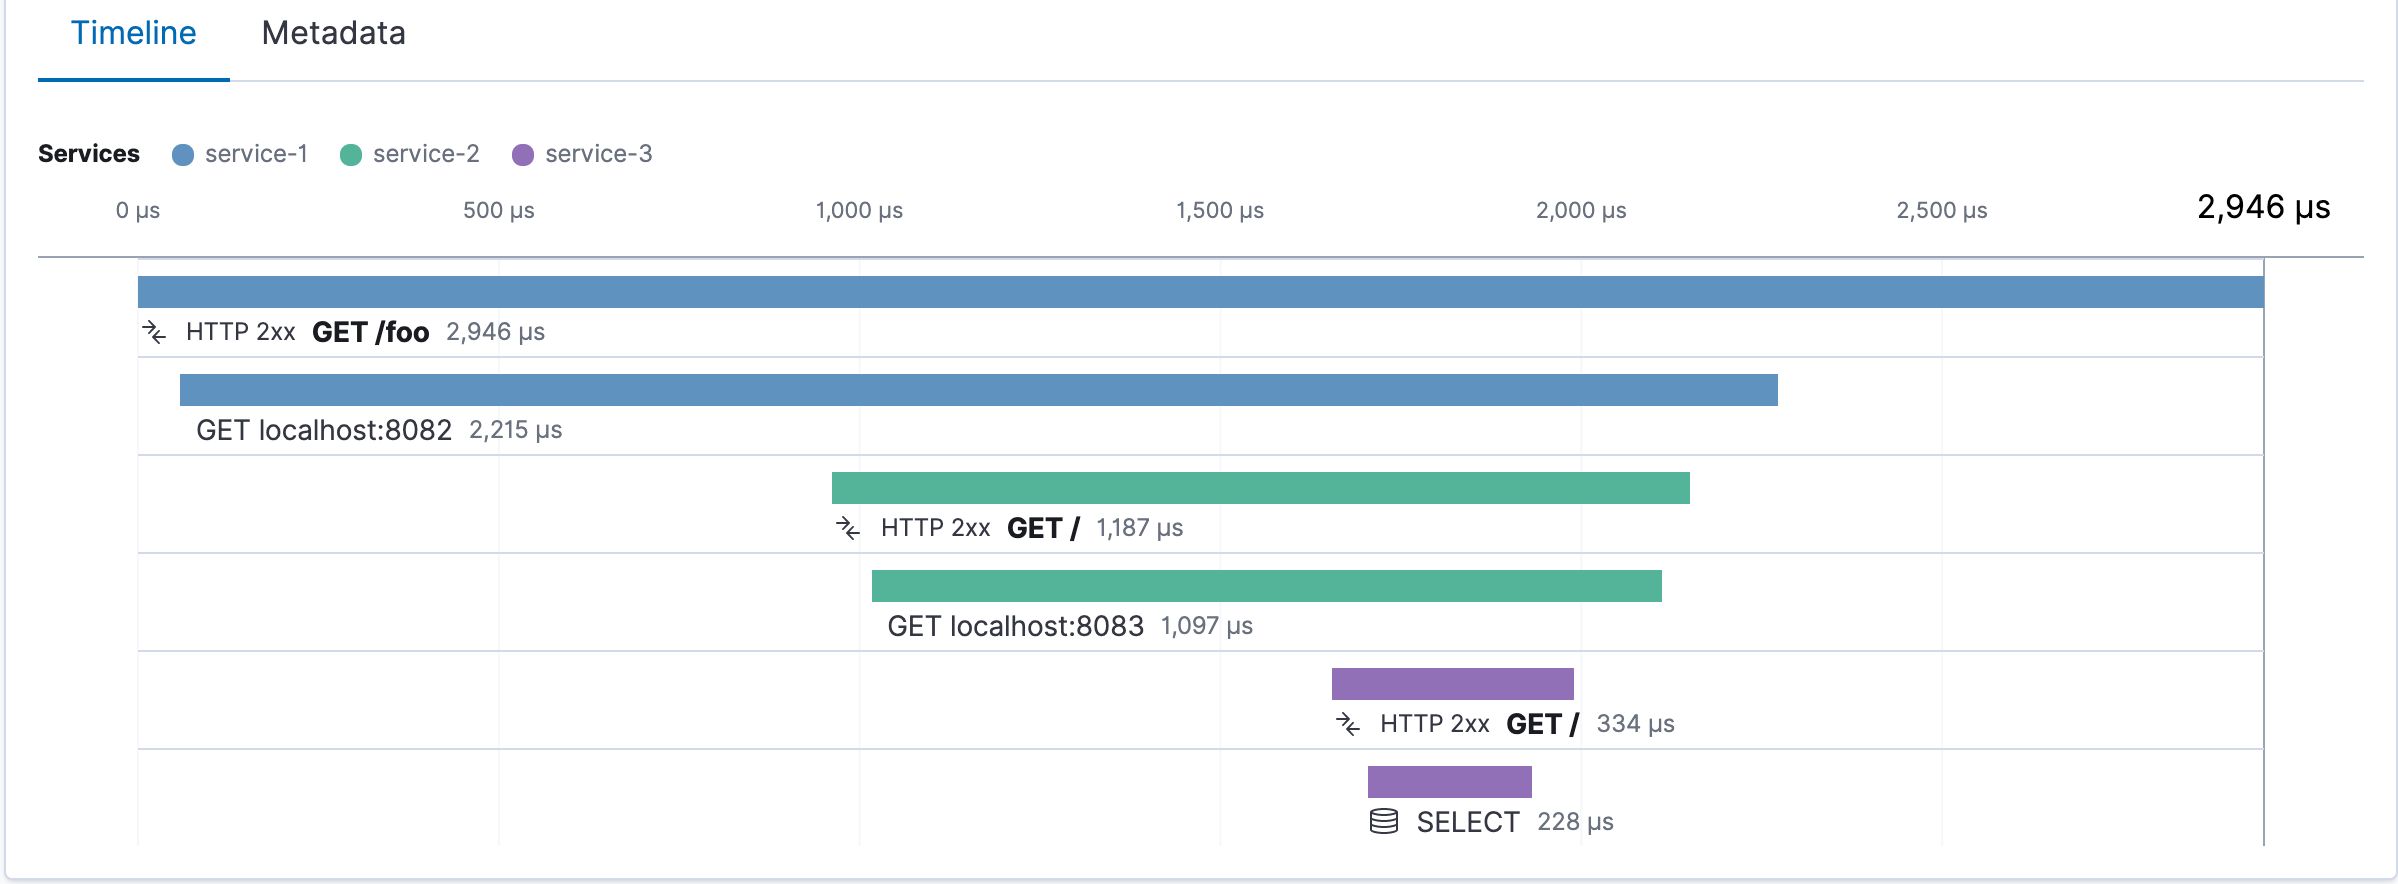
is extensively useful in monitoring the lifecycle of a HTTP request in a system especially in µservices architecture. Wide variety of web frameworks and databases are supported which is useful in tracking the request up to DB calls. The is simple and concise which makes it easy to instrument the application. This article aims to help or at least make it easy to trace the HTTP request lifecycle after instrumentation. is used in this article for code snippets but the concept can be extended to other languages as well. Elastic APM documentation Golang After instrumentation, if we look into APM dashboard of our service, we get the transaction distribution similar to the image below. Now, there are eleven requests in a particular duration. So, how to find a particular request among them? General technique used in microservices architecture to trace the request is Correlation ID. So is there anything similar to correlation ID in elastic APM? Well, Sort of. Elastic APM supports and it is compliant. According to , a http header named is passed in requests which makes distributed tracing possible. Its is defined by W3C and an example is shown below. distributed tracing OpenTracing W3C standard Traceparent format - - - -cfcc5fb87332693caae03bcdf41832f8 d06f33a2fd577a "version" "trace-id" "span-id" "trace-flags" 00 -25 -01 Trace ID is similar to correlation ID and it is unique. A search with TraceID provides that single request as shown below. How to get this Trace ID then? 1. Using (Real user monitoring). This javascript agent is used to instrument the frontend. It sends the header for every request made from frontend and from the developer tools, trace ID can be selected from the header. RUM Traceparent 2. From application, we can extract this TraceID as shown in below . Extracted TraceID can be logged and thus used in finding the request in APM dashboard. code snippet { apmTx := apm.DefaultTracer.StartTransaction( , ) fmt.Println(apmTx.TraceContext().Trace.String()) apmTx.End() } { apmTx := apm.TransactionFromContext(r.Context()) fmt.Println(apmTx.TraceContext().Trace.String()) apmTx.End() } // from new transaction func Foo () "transaction_name" "transaction_type" // prints TraceID // from incoming http request func FooHandler (w http.ResponseWriter, r *http.Request) // prints TraceID Then why custom Trace ID? What if my application didn't have frontend? How to trace the request which comes to my API server from third parties? And how to debug an issue in particular µservice? What If I want to instrument my µservices gradually but still want to track my request? The idea is to create a custom trace id and expose that via header in response. Using that header we can search for that particular request in the APM dashboard. I have used as the response header. Traceid Custom Trace ID is generated by a middleware which wraps the incoming http requests. If the trace id is already present in request, it is written in the outgoing response header. If not a new one is created. The new trace ID is created using UUID. Span ID is the last 8 bytes of trace ID and the trace options should be set as recorded so that the elastic APM server will track the request. Then it is changed to header format and attached to the request. Traceparent { http.HandlerFunc( { traceID apm.TraceID values := r.Header[apmhttp.W3CTraceparentHeader]; (values) == && values[ ] != { c, err := apmhttp.ParseTraceparentHeader(values[ ]); err == { traceID = c.Trace } } err := traceID.Validate(); err != { uuid := uuid.New() spanID apm.SpanID traceOptions apm.TraceOptions (traceID[:], uuid[:]) (spanID[:], traceID[ :]) traceContext := apm.TraceContext{ Trace: traceID, Span: spanID, Options: traceOptions.WithRecorded( ), } r.Header.Set(apmhttp.W3CTraceparentHeader, apmhttp.FormatTraceparentHeader(traceContext)) } w.Header().Set(TraceID, traceID.String()) next.ServeHTTP(w, r) }) } . func SetTraceID (next http.Handler) http Handler return func (w http.ResponseWriter, r *http.Request) var if len 1 0 "" if 0 nil if nil var var copy copy 8 true The code and examples are present in . Github By using this method, requests from clients like can also be traced as shown below. Postman Postman: APM Dashboard: References https://www.w3.org/TR/2020/REC-trace-context-1-20200206/ https://www.elastic.co/blog/distributed-tracing-opentracing-and-elastic-apm