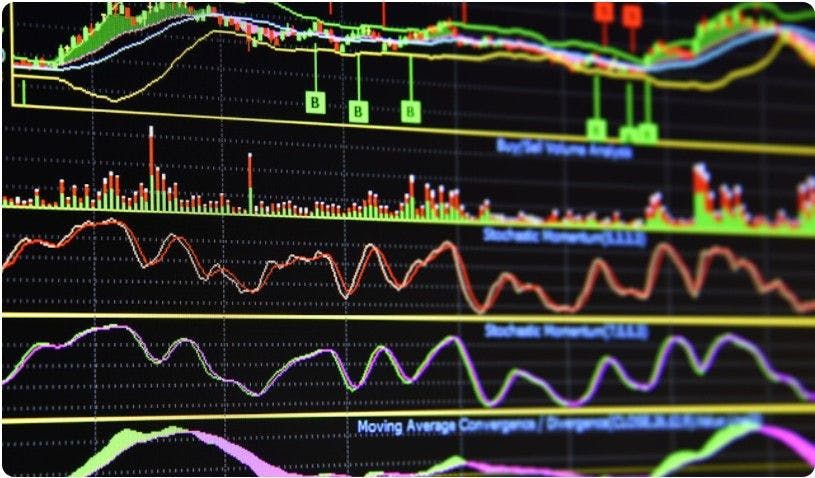
Bybit is one of the fastest growing cryptocurrency derivatives exchanges, with more than a million registered users.
Cryptocurrencies aren’t technically a financial asset, yet it’s famous for both traders and investors for many reasons. Bitcoin, the first virtual currency ever launched, has an average daily trading volume of 23.3 billion USD, and the incredible bull’s price is undoubtedly catching all the headlines. Whether you’re crypto curious or an enthusiast who’s FOMO to dip your feet into the hype, using technical indicators to trade is inevitable.
To get started right, you’ll first need to understand how crypto technical indicators work and how it’s being used differently from traditional markets, their categories, and functions. As we dive deeper, we’ll introduce some of the best technical indicators you certainly don’t want to miss.
Ok, but what exactly is a technical indicator?
A technical explanation refers technical indicator as a trading instrument that allows a trader to calculate the trading patterns, price, or volume of past an asset to figure out how the market reacts in the short future.
Think of it this way; technical indicators help you speculate an asset’s price, including digital assets like crypto, to maximize gains.
In other words, they allow you to anticipate a price, confirm a technical analysis that another indicator is pointing out, and receive alerts from an asset’s pattern.
This way, you can forecast price movements and trends before making your final choice.
Just take note that indicators are especially useful ONLY if you understand how to use, compare, and combining them while keeping in mind your trading plan. Once you’re clear with the concept, you can easily analyze them from a one-minute chart to a weekly or monthly chart.
First of all, technical indicators are divided into two categories depending on what they’re meant to identify. Below we have explained what each of these reveals.
A leading indicator is a technical study developed to anticipate an asset’s price action’s future movement. The idea behind leading indicators is that history is cyclical, and it tends to repeat itself. So that past price action movements can anticipate the future.
Long story short, leading indicators are conditions that, when converge, signal a particular direction in the crypto price action.
Still, it is recommendable to use leading indicators in combination with other types of technical indicators for a more reliable signal. Also, remember that even the most popular technical indicators can not predict the future 100%.
On the other hand, lagging indicators are technical studies that provide confirmations when the current trend or movement is in progress. It means traders usually won’t take the tops or bottoms of the moves but rather double confirmation of a developing trend.
Similar to leading indicators, lagging studies are based on the assumption that history repeats itself and price actions move on cycles. The difference is that the lag between the start of the movement and the signal provides extra confidence to traders. The reason is that lagging indicators filter the market noise that occurs in short-term timeframes.
Although they provide a more confident signal, experts recommend confirming lagging indicator signals with other complementary technical studies. Also, don’t trade a call if you see particular support or resistance levels ahead of your movement.
When it comes to the types, there are four different technical indicators: momentum or oscillator, volume, volatility, and trend. And each of these has a subcategory.
First, they are divided because they will identify, measure, or confirm a price-performance along with a particular characteristic.
These indicators are used for stocks, forex, crypto trading, and other assets. They will be useful if you keep your trade in mind and use them at your convenience.
Momentum or oscillator indicators are used to measure the rise and fall of an asset. Typically, this indicator is more advantageous with rising markets than falling markets. You would use an oscillator indicator for a trade signal in a crypto chart.
Depending on what you need, you have the following subcategories to choose from:
On the other hand, this oscillator helps to compare the closing price of a cryptocurrency or another security to a spectrum of its prices during a specific time period. It is beneficial if you would like to have signals of bullish or bearish trends or even to generate overbought and oversold trading signals.
While Stochastic can be used in tandem with RSI, it’s distinguished by its predicament on the closing prices where it should come in the same direction as the current trend.
It is important to note that convergence is when these two moving averages start to move closer to each other and decrease in momentum. On the other hand, divergence would be the opposite, so momentum would be increasing while the moving averages are distancing.
Typically, MACD can be used in conjunction with RSI. But it’s also one of the best technical indicators for swing trading.
This technical indicator was born in Japan, and it works better on crypto graphics that show weekly or monthly activity. That is because it uses four different time intervals. One of these is calculated using the average price between the maximum and interval of a minimum, divided in half.
Volume indicators are another category of technical indicators you can use to increase profit and minimize risk. You can have entry and exit signals once you associate them with the correct formula since each indicator uses a different one.
Below we will explain the subcategories of these indicators:
In this case, the direction does not matter when this indicator is measuring the price movement. You can use these to know the points where the market might change directions according to the highest and lowest historical security prices.
Bollinger bands are one of the most popular indicators. But what you may not know is Bollinger bands do not tell you the direction of a breakout. Instead, it is used to identify market volatility and the heavily transacted areas. Hence, to signal you that a breakout is about to happen.
At first, the indicator was for commodity markets, but it is now used for all other securities like stocks and cryptocurrencies.
The Keltner channel consists of three lines where the middle one is the exponential moving average or EMA, which follows recent price changes. The upper band shows bullish trends while the lower band indicates bearish. A channel-like appearance forms when all three of lines are plotted based on the volatility and average prices of an asset.
Trend indicators will measure which way the market is moving and what trend it presents. This way, the asset’s momentum should help you speculate if the direction will continue moving in your favor.
The volume indicator will compare the security’s demand versus its supply. It is beneficial for traders who need to know what the force is behind the price trend. The concept is simple, just think of it this way:
When there’s an increase in trading volume, it’s interpreted as a healthy market. Which then signals you that the market is active. On the contrary, when prices fall on increasing volume, the trend is gathering strength to the downside.
All in all, you will know when the market is gaining strength and increasing all by analyzing the trading volume.
Moving averages will always keep you updated on the asset’s average price. You will visualize this indicator as a line on a chart that will take over any time period a trader decides. It can be a time period from a few minutes or many weeks.
There are different types of moving averages that are calculated on price events: Simple Moving Average (SMA), Exponential Moving Average (EMA), Smoothed Moving Average (SMMA), and Linear Weighted Moving Average (LWMA).
As you know, technical indicators can be used to analyze different securities such as commodities, forex, stocks, and of course, cryptocurrency. Including indicators in your strategy can help you decide if you want to make the trade you have in mind. In fast-moving markets such as cryptocurrencies, it is crucial to identify signals or trends because timing is key.
Still, there are few things you must know!
Firstly, even the best technical indicator can be used together or compared to each other, but there is a limit. Up to two or three is acceptable since more will only leave you helpless. When you know your trading goal, and what you need to know, it is time to choose indicators that will show you different signals. Perhaps, use complementary indicators (those that present different views of the market while working collectively to provide meaningful data on which to base trading decisions.)
Sure you can just wing it and be spontaneous. But, you must always keep in mind what your trading plan is for the worst-case scenario. That way, you can choose the correct indicators and implement them according to your needs. Plus, the signals you get from the indicators you choose should confirm each other.
In the financial world, knowledge is what will guide you to increase your profit and stay away from losses. That is why you must learn what each indicator is for and how it can benefit your financial speculation.
Knowledge should also be complemented by being able to control your emotions in stressful situations. If an indicator shows you that the price is going the wrong way, it is essential to act calmly and follow your trading plan.
Technical analysis is all about probability. That means, even the most accurate technical indicators can give a mixed signal when used in isolation. In any case, the best way to mitigate such issues is to use a different combination of indicators to help you determine ideal entry and exit signals.
While the fundamentals are pretty much the same, still the validity of the technical analysis may be contracting from one analyst to another.
Technical indicators are tools that will calculate patterns, an average trading volume, or the price of a security. They will help you maximize gains if used correctly. There are two main categories of indicators: leading and lagging.
Then there are four types of indicators, including the momentum or oscillator, volume, volatility, and trend. Each of these is then sub-divided into other categories that have specific characteristics and measurements.