382 reads
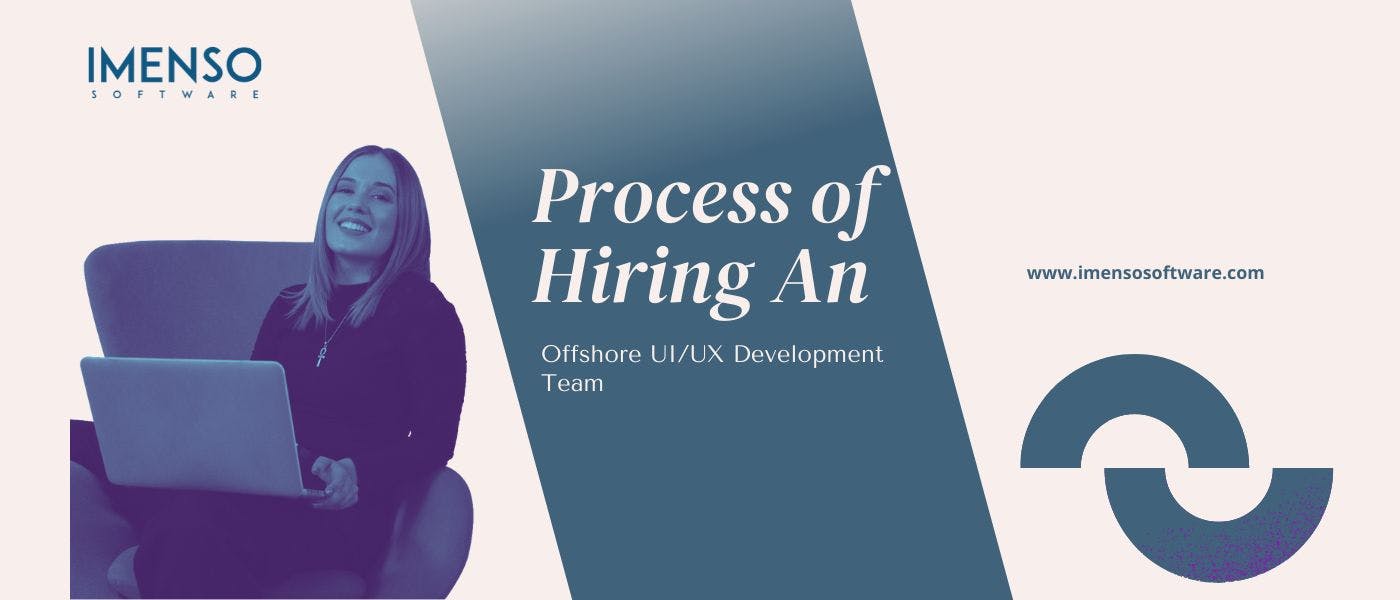
6 Tips to Get More Value Out of Your Microsoft Power BI Dashboard & Reports
by byImenso Software@imensosoftware
Imenso Software is a client focused custom software development company.
January 6th, 2022


Imenso Software is a client focused custom software development company.


Imenso Software is a client focused custom software development company.
About Author
Imenso Software is a client focused custom software development company.
Comments