paint-brush
5 Key Load Balancer Performance Metrics You Should Trackby@Middleware
1,535 reads
1,535 reads

5 Key Load Balancer Performance Metrics You Should Track

by MiddlewareJanuary 13th, 2022
Read on Terminal Reader
Read this story w/o Javascript
tldt arrow

Too Long; Didn't Read

The load balancer plays a critical role in creating a highly available and scalable architecture for your web application. It is the switchboard operator that directs traffic to the server with the most negligible load. Load balancers can also route traffic to multiple servers to help manage resource usage and avoid server overload. It's not always easy to identify load balancing configuration and performance issues. The performance metrics you should be tracking will vary from app to app, depending on what type of service you're providing, resources required, and so on.
featured image - 5 Key Load Balancer Performance Metrics You Should Track
Middleware HackerNoon profile picture

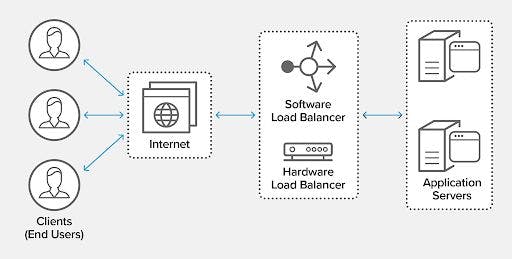
The load balancer plays a critical role in creating a highly available and scalable architecture for your web application. It is the switchboard operator that directs traffic to the server with the most negligible load. Load balancers can also route traffic to multiple servers to help manage resource usage and avoid server overload.

The most common type of load balancer is the hardware or software load-balancing device, often referred to as a "router". Other geographically distributed routers may also be involved in routing traffic, such as an Internet Service Provider (ISP) router, as well as routers within your data center.

It's not always easy to identify load balancing configuration and performance issues.

Why is it Important to Monitor Your Load Balancers?

Some standard key load balancer performance metrics can help you determine if your key load balancer is performing well. The first thing to look at is the percentage of connections dropped. This shows you if your load balancer is overloaded or too many connections are being made to the load balancer. If you have an active application, you might have many connections being made.

You should design your application only to open a connection once and then close it when done. The benefit of this is that it saves memory on your load balancer and processing power since the connection does not need to be kept open.

Image Source

Another thing to look at is TCP Retransmissions Delta, which is the number of times a particular packet was retransmitted for it to be received successfully by a client. This can show how bad the network connectivity is between your clients and the load balancer. A high number here can indicate problems with the network connection between your clients and your load balancer.

As you scale your web applications, one of the most critical challenges is identifying and managing the performance of your load balancer. The performance metrics you should be tracking with your load balancer will vary from app to app, depending on what type of service you're providing, the resources required, and so on. However, some common metrics can help you manage load balancer performance at all levels.

Key Metrics to Track the Performance of Your Load Balancer

Scalability is one of the most important metrics of any development project. The design, implementation, and operation must be scalable to support more significant users. Load balancers are the critical element determining your application's scalability and performance. You should know how your load balancer performs in terms of throughput and latency. Below are some load balancer metrics that you should be tracking to ensure your load balancer is optimized for high availability, performance, and scalability.

Image Source

Load balancers are a critical component of any modern application architecture, but that's not to say they're without their faults. A load balancer is a crucial part of your application's infrastructure, so it's essential to know if your load balancer is working correctly and how it affects other components in your system. Here are five metrics you should track:

Requests per second (RPS) – The load balancer can handle the number of requests. RPS is one of the most common and essential metrics to track on a load balancer. This metric tells you how many requests the load balancer can handle per second. If your RPS is low, it's an indicator your load balancer isn't performing at its peak capability.

For example, if you have an application that receives 100 HTTP requests per second, the load balancer can handle up to 100 requests per second. It doesn't matter what kind of load you're putting on it – hardware, software, resource constraints – as long as the incoming requests are being handled at the same rate they're coming in.

Latency – The average amount of time it takes for a request to reach the server. You want this value to be as low as possible, especially when your website has many users. If the latency becomes very high, users may experience slow response times or even timeouts.

A low latency value is desirable, but there are some things you need to take into consideration. If you have multiple servers in a pool, and all of them are performing tasks simultaneously, there can be more requests than servers available. This can cause request queues to grow, which leads to longer latencies. Also, note that if your load balancer uses SSL encryption with client authentication, response times may be longer than usual because of the extra processing overhead involved in SSL.

Availability – Percentage of time the load balancer is available for use. This is not the same as uptime, which tells you about a machine's availability from the network's perspective. If a server has a 99% uptime but is only available for 1 second out of every minute, you can't use it for any serious application. The availability metric provides information about how the load balancer processes long requests.

For example, if a load balancer is configured with an availability of 99%, then one out of 100 requests will encounter an error while being processed by the system. Measurements are typically provided in 5-minute intervals and should cover at least 24 hours or longer.

Response time – A server takes to respond to requests. Response times are essential, especially if you are hosting applications or services that require speedy responses, such as e-commerce sites or live chat systems. If you decide to track this metric, you'll need to measure response times on individual components or instances of your load balancer.

Response times are an indication of how quickly the user receives content. A longer-than-expected response time may be caused by network congestion, poor DNS resolution or database issues.

Capacity – Determines the maximum throughput capacity of the load balancer. It is a critical metric because it reveals how much work the device can handle before becoming overloaded. Capacity can be determined by monitoring throughput and request latency for a period of time and then extrapolating these values.

Your application or site should be tested for a period of time to establish baseline measurements for throughput, requests per second (RPS), and latency. These values should then be monitored over time as you add users or services to your infrastructure.

Load balancers distribute web traffic across multiple servers, so if the servers are constantly busy, you may need to add additional servers or upgrade existing ones.

Wrapping Up

Load balancers play a crucial role in many applications, handling traffic routing and distributing it to multiple servers. In turn, load balancers can affect the performance of your application, so it's vital to know load balancer metrics that can help you ensure that your web application is running smoothly.