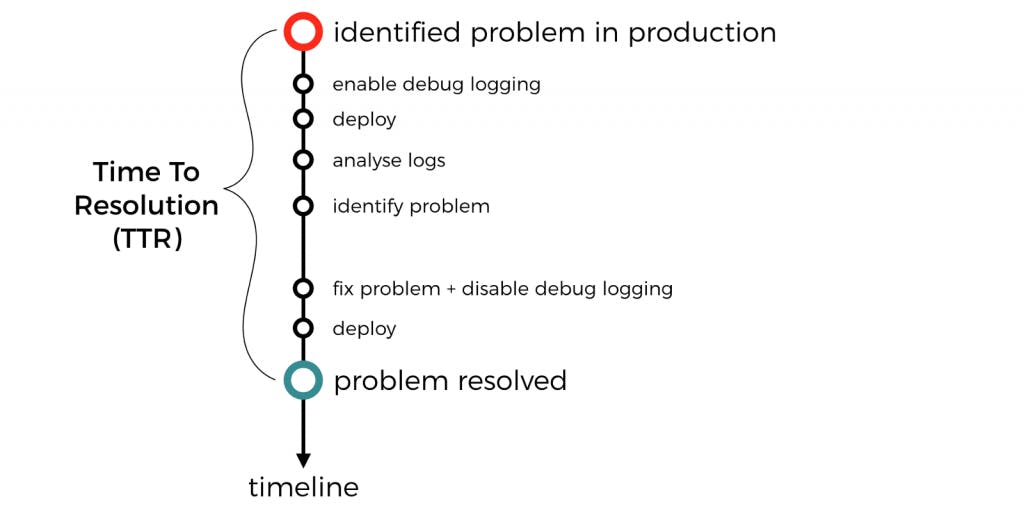
It’s common practice to set log level to WARNING for production due to traffic volume. This is because we have to consider various cost factors: : charges $0.50 per GB ingested. In my experience, this is often much higher than the Lambda invocation costs cost of logging CloudWatch Logs : charges $0.03 per GB per month, and its default retention policy is ! A common practice is to ship your logs to another log aggregation service and to set the retention policy to X days. See for more details. cost of storage CloudWatch Logs Never Expire this post : if you’re processing the logs with , then you also have to factor in the cost of invocations. cost of processing Lambda Lambda But, doing so leaves us without ANY debug logs in production. When a problem happens in production, you won’t have the debug logs to help identify the root cause. Instead you have to waste precious time to deploy a new version of your code to enable debug logging. Not to mention that you shouldn’t forget to disable debug logging when you deploy the fix. With microservices, you often have to do this for more than one service to get all the debug messages you need. All these, . That’s not what we want. increases the mean time to recovery (MTTR) during an incident It doesn’t have to be like that. There is a happy middle ground between having no debug logs and having all the debug logs. Instead, we should sample debug logs from a small percentage of invocations. I demoed how to do this in the chapter of my video course . You need two basic things: Logging Production-Ready Serverless a logger that lets you to change the logging level dynamically, e.g. via environment variables. a middleware engine such as middy With , I don’t need most of the features from a fully-fledged logger such as . Instead, I prefer to use a simple logger module like . It’s written in a handful of lines and gives me the basics: Lambda pino this one structured logging with JSON ability to log at different levels ability to control the log level dynamically via environment variables Using , I can create a to dynamically update the log level to DEBUG. It does this for a configurable percentage of invocations. At the end of the invocation the middleware would restore the previous log level. middy middleware You might notice that we also have some special handling for when the invocation errs. This is to ensure we capture the error with as much context as possible, including: the unique AWS Request ID the invocation event, so we can and debug the problem replay the invocation event locally the error message and stacktrace Having debug logs for a small percentage of invocation is great. But when you’re dealing with microservices you need to make sure that your debug logs cover an entire call chain. That is the only way to put together a complete picture of everything that happened on that call chain. Otherwise, you will end up with fragments of debug logs from many call chains but never the complete picture of one. You can do this by forwarding the decision to turn on debug logging as a correlation ID. The next function in the chain would respect this decision, and pass it on. See for more detail. this post So that’s it, another pro tip on how to build observability into your serverless application. If you want to learn more about how to go all in with serverless, check out my 10-step guide . here Until next time! Like what you’re reading but want more help? I’m happy to offer my services as an and help you with your serverless project — architecture reviews, code reviews, building proof-of-concepts, or offer advice on leading practices and tools. independent consultant I’m based in and currently the only UK-based . I have nearly of with running production workloads in AWS at scale. I operate predominantly in the UK but I’m open to travelling for engagements that are longer than a week. To see how we might be able to work together, tell me more about the problems you are trying to solve . London, UK AWS Serverless Hero 10 years experience here I can also run an to help you get with your serverless architecture. You can find out more about the two-day workshop , which takes you from the basics of AWS Lambda all the way through to common operational patterns for log aggregation, distribution tracing and security best practices. in-house workshops production-ready here If you prefer to study at your own pace, then you can also find all the same content of the workshop as a I have produced for Manning. We will cover topics including: video course authentication authorization with API Gateway Cognito & & testing running functions locally & CI/CD log aggregation monitoring best practices distributed tracing with X-Ray tracking correlation IDs performance cost optimization & error handling config management canary deployment VPC security leading practices for Lambda, Kinesis, and API Gateway You can also get the face price with the code . Hurry though, this discount is only available while we’re in Manning’s Early Access Program (MEAP). 40% off ytcui