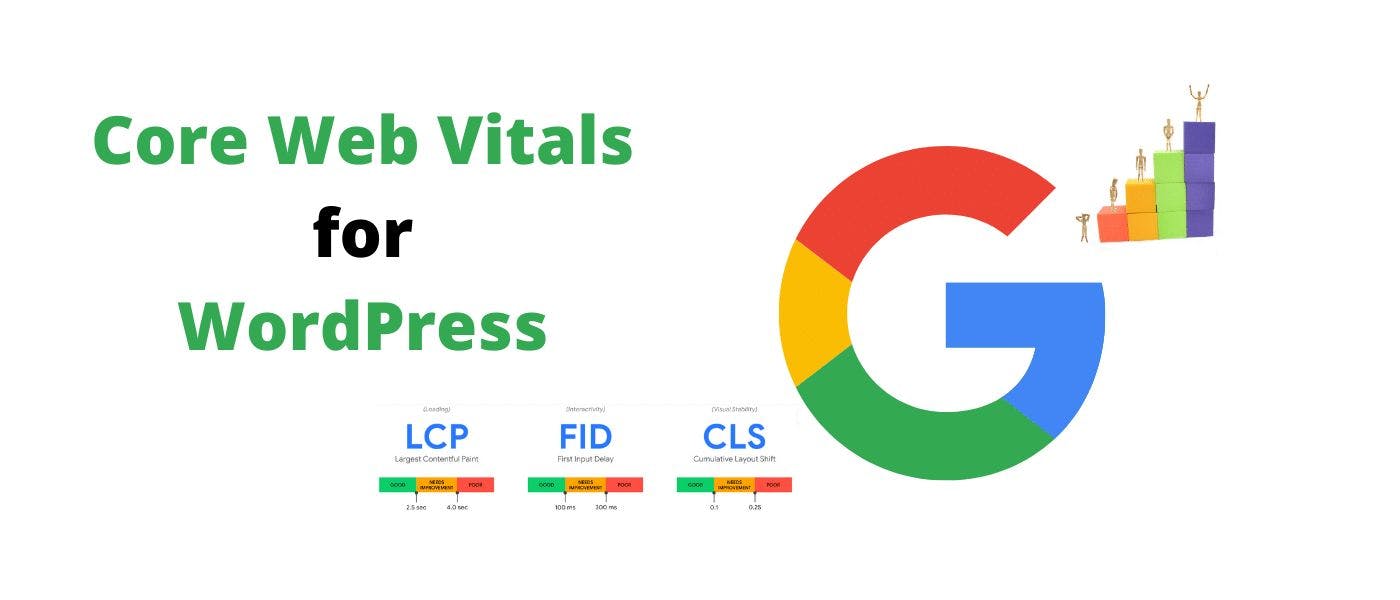
In today’s lightning-fast digital landscape, website speed is no longer a luxury — it’s a fundamental requirement. Every developer should possess the knowledge to analyze and optimize web page performance for a seamless user experience. After all, a speedy website translates into higher engagement, lower bounce rates, and ultimately, increased conversions. The High Cost of Slow Websites The detrimental effects of sluggish websites are well-documented by numerous studies: Upward of 25% of users abandon a site if it takes longer than 4 seconds to load Akami Study. A 3-second delay can lead to a significant drop in engagement, with 22% fewer page views and a 50% higher bounce rate Strangeloop Networks Study. Conversions take a major hit for websites taking 5 seconds to load, experiencing a decrease of 38% Strangeloop Networks Study. Pinterest increased search engine traffic and sign-ups by 15% when they reduced perceived wait times by 40%. The BBC found they lost an additional 10% of users for every extra second their site took to load. Prioritizing Core Web Vitals Forget outdated metrics — Google prioritizes Core Web Vitals for website performance evaluation. These metrics measure real-world user experience and directly impact search engine rankings. Here’s a breakdown of the three key Core Web Vitals: Largest Contentful Paint (LCP): This tracks the time it takes for the largest content element to load. Optimize images and preload content to improve LCP (ideally under 2.5 seconds). Learn more about LCP Interaction to Next Paint (INP): This metric measures the user’s perceived responsiveness. Aim for an INP of under 50 milliseconds. Learn more about INP Cumulative Layout Shift (CLS): This metric assesses how much your page layout shifts as elements load. Use pre-defined dimensions for images and avoid lazy loading critical content to minimize CLS (ideally below a score of 0.1). Learn more about CLS Optimizing for Interactivity Beyond loading speed, interactivity matters. Here’s how to ensure your page feels responsive: Time to Interactive (TTI): This measures the time it takes for your page to become fully interactive. Reduce unnecessary JavaScript and optimize critical rendering paths to achieve a TTI under 3.1 seconds. Learn more about TTI Total Blocking Time (TBT): This metric focuses on how long your main thread is blocked by JavaScript execution. Minimize render-blocking JavaScript and leverage code splitting to keep TBT below 3.1 seconds. Learn more about TBT Actionable Steps for Improvement Leverage a CDN: Consider a content delivery network (CDN) to improve content delivery speed for geographically dispersed users. Monitor CDN performance, including cache hit rate and first-byte time. Remember to carefully consider the Time-to-Live (TTL) of your content. A longer TTL can improve performance by reducing the number of requests to your origin server, but it can also lead to stale content if not managed properly. Minify and Optimize Resources: Reduce file sizes and optimize images for web delivery. Implement Lazy Loading: Load non-critical content below the fold only when the user scrolls down to improve initial page load. Utilize Browser Caching: Enable browser caching for static assets to reduce server requests on subsequent visits. Other Considerations While Core Web Vitals and interactivity metrics provide a solid foundation, there are other factors to consider for comprehensive website performance optimization: Network Performance: Although not directly measured by Lighthouse, network response times significantly impact user experience. Tools like Google PageSpeed Insights can help identify network bottlenecks. Server-Side Optimization: Optimizing server response times and resource processing can significantly improve perceived website performance. Continuous Monitoring and Improvement Remember, website performance is an ongoing process. Regularly monitor your website’s performance metrics using tools like Google PageSpeed Insights and Lighthouse. Continuously analyze and optimize your code, content, and infrastructure to ensure a top-notch user experience. In today’s lightning-fast digital landscape, website speed is no longer a luxury — it’s a fundamental requirement. Every developer should possess the knowledge to analyze and optimize web page performance for a seamless user experience. After all, a speedy website translates into higher engagement, lower bounce rates, and ultimately, increased conversions. The High Cost of Slow Websites The detrimental effects of sluggish websites are well-documented by numerous studies: Upward of 25% of users abandon a site if it takes longer than 4 seconds to load Akami Study. A 3-second delay can lead to a significant drop in engagement, with 22% fewer page views and a 50% higher bounce rate Strangeloop Networks Study. Conversions take a major hit for websites taking 5 seconds to load, experiencing a decrease of 38% Strangeloop Networks Study. Pinterest increased search engine traffic and sign-ups by 15% when they reduced perceived wait times by 40%. The BBC found they lost an additional 10% of users for every extra second their site took to load. Upward of 25% of users abandon a site if it takes longer than 4 seconds to load Akami Study . Akami Study A 3-second delay can lead to a significant drop in engagement, with 22% fewer page views and a 50% higher bounce rate Strangeloop Networks Study . Strangeloop Networks Study Conversions take a major hit for websites taking 5 seconds to load, experiencing a decrease of 38% Strangeloop Networks Study . Strangeloop Networks Study Pinterest increased search engine traffic and sign-ups by 15% when they reduced perceived wait times by 40%. Pinterest increased search engine traffic and sign-ups by 15% The BBC found they lost an additional 10% of users for every extra second their site took to load. The BBC found they lost an additional 10% of users Prioritizing Core Web Vitals Forget outdated metrics — Google prioritizes Core Web Vitals for website performance evaluation. These metrics measure real-world user experience and directly impact search engine rankings. Here’s a breakdown of the three key Core Web Vitals: Core Web Vitals Largest Contentful Paint (LCP): This tracks the time it takes for the largest content element to load. Optimize images and preload content to improve LCP (ideally under 2.5 seconds). Learn more about LCP Interaction to Next Paint (INP): This metric measures the user’s perceived responsiveness. Aim for an INP of under 50 milliseconds. Learn more about INP Cumulative Layout Shift (CLS): This metric assesses how much your page layout shifts as elements load. Use pre-defined dimensions for images and avoid lazy loading critical content to minimize CLS (ideally below a score of 0.1). Learn more about CLS Largest Contentful Paint (LCP): This tracks the time it takes for the largest content element to load. Optimize images and preload content to improve LCP (ideally under 2.5 seconds). Learn more about LCP Largest Contentful Paint (LCP): Learn more about LCP Interaction to Next Paint (INP): This metric measures the user’s perceived responsiveness. Aim for an INP of under 50 milliseconds. Learn more about INP Interaction to Next Paint (INP): Learn more about INP Cumulative Layout Shift (CLS): This metric assesses how much your page layout shifts as elements load. Use pre-defined dimensions for images and avoid lazy loading critical content to minimize CLS (ideally below a score of 0.1). Learn more about CLS Cumulative Layout Shift (CLS): Learn more about CLS Optimizing for Interactivity Beyond loading speed, interactivity matters. Here’s how to ensure your page feels responsive: Time to Interactive (TTI): This measures the time it takes for your page to become fully interactive. Reduce unnecessary JavaScript and optimize critical rendering paths to achieve a TTI under 3.1 seconds. Learn more about TTI Total Blocking Time (TBT): This metric focuses on how long your main thread is blocked by JavaScript execution. Minimize render-blocking JavaScript and leverage code splitting to keep TBT below 3.1 seconds. Learn more about TBT Time to Interactive (TTI): This measures the time it takes for your page to become fully interactive. Reduce unnecessary JavaScript and optimize critical rendering paths to achieve a TTI under 3.1 seconds. Learn more about TTI Time to Interactive (TTI): Learn more about TTI Total Blocking Time (TBT): This metric focuses on how long your main thread is blocked by JavaScript execution. Minimize render-blocking JavaScript and leverage code splitting to keep TBT below 3.1 seconds. Learn more about TBT Total Blocking Time (TBT): Learn more about TBT Actionable Steps for Improvement Leverage a CDN: Consider a content delivery network (CDN) to improve content delivery speed for geographically dispersed users. Monitor CDN performance, including cache hit rate and first-byte time. Remember to carefully consider the Time-to-Live (TTL) of your content. A longer TTL can improve performance by reducing the number of requests to your origin server, but it can also lead to stale content if not managed properly. Minify and Optimize Resources: Reduce file sizes and optimize images for web delivery. Implement Lazy Loading: Load non-critical content below the fold only when the user scrolls down to improve initial page load. Utilize Browser Caching: Enable browser caching for static assets to reduce server requests on subsequent visits. Leverage a CDN: Consider a content delivery network (CDN) to improve content delivery speed for geographically dispersed users. Monitor CDN performance, including cache hit rate and first-byte time. Remember to carefully consider the Time-to-Live (TTL) of your content. A longer TTL can improve performance by reducing the number of requests to your origin server, but it can also lead to stale content if not managed properly. Leverage a CDN: Minify and Optimize Resources: Reduce file sizes and optimize images for web delivery. Minify and Optimize Resources: Implement Lazy Loading: Load non-critical content below the fold only when the user scrolls down to improve initial page load. Implement Lazy Loading: Utilize Browser Caching: Enable browser caching for static assets to reduce server requests on subsequent visits. Utilize Browser Caching: Other Considerations While Core Web Vitals and interactivity metrics provide a solid foundation, there are other factors to consider for comprehensive website performance optimization: Network Performance: Although not directly measured by Lighthouse, network response times significantly impact user experience. Tools like Google PageSpeed Insights can help identify network bottlenecks. Server-Side Optimization: Optimizing server response times and resource processing can significantly improve perceived website performance. Network Performance: Although not directly measured by Lighthouse, network response times significantly impact user experience. Tools like Google PageSpeed Insights can help identify network bottlenecks. Network Performance: Server-Side Optimization: Optimizing server response times and resource processing can significantly improve perceived website performance. Server-Side Optimization: Continuous Monitoring and Improvement Remember, website performance is an ongoing process. Regularly monitor your website’s performance metrics using tools like Google PageSpeed Insights and Lighthouse. Continuously analyze and optimize your code, content, and infrastructure to ensure a top-notch user experience.