paint-brush
Things I Can Learn From Knowing Who is Making and Loosing Money in Crypto-Assetsby@jrodthoughts
244 reads

Things I Can Learn From Knowing Who is Making and Loosing Money in Crypto-Assets

by Jesus RodriguezJanuary 14th, 2020
Read on Terminal Reader
Read this story w/o Javascript
tldt arrow

Too Long; Didn't Read

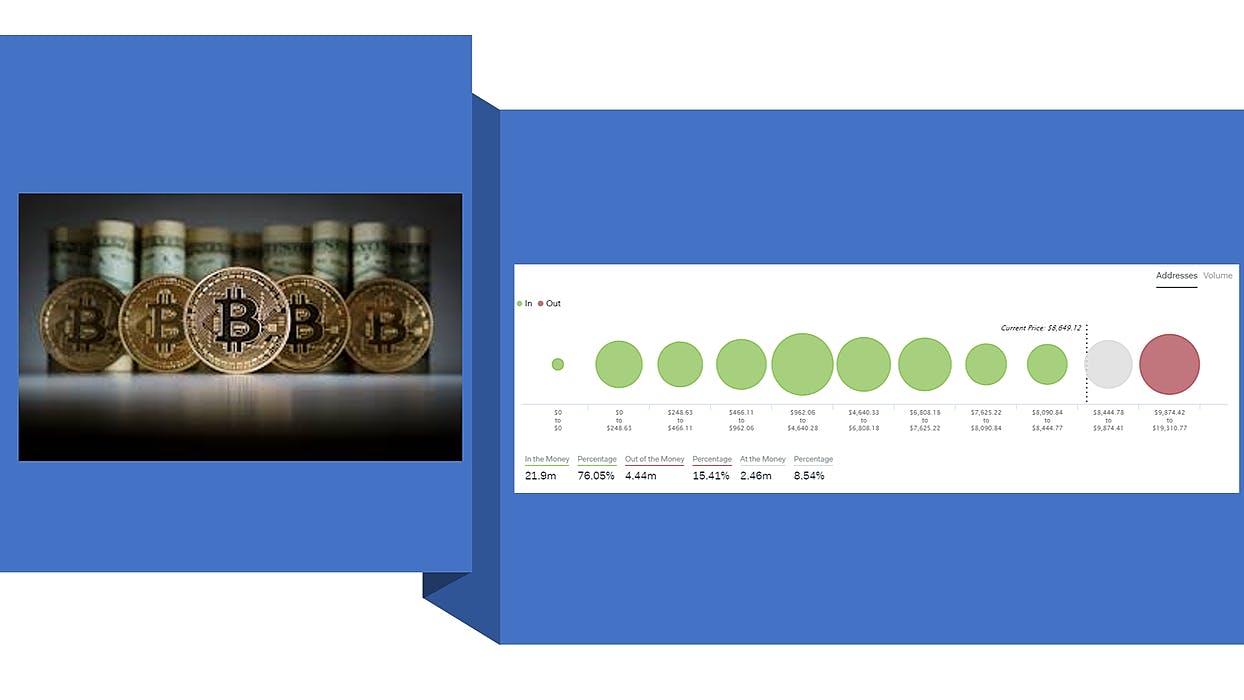
The In-Out-Money(IOM) signal has become one of the most popular analytical signals of the IntoTheBlock platform. Conceptually, the IOM analysis provides a statistical distribution of aggregated positions of investors in a crypto-asset relative to the current price. The analysis leverages unsupervised learning algorithms against a dataset of all the transactions ever recorded for a specific crypto-token in a given blockchain. For example, Bitcoin has a massive level of resistance around the $170 price mark with over 3 million addresses holding positions at those levels.

Coin Mentioned

Mention Thumbnail
featured image - Things I Can Learn From Knowing Who is Making and Loosing Money in Crypto-Assets
Jesus Rodriguez HackerNoon profile picture

The In-Out-Money(IOM) signal has become one of the most popular analytical signals of the IntoTheBlock platform. Conceptually, the IOM analysis provides a statistical distribution of aggregated positions of investors in a crypto-asset relative to the current price. That’s a fancy way to say, that IOM shows you different groups of investors realizing gains and losses in a crypto-asset. The analysis leverages unsupervised learning algorithms against a dataset of all the transactions ever recorded for a specific crypto-token in a given blockchain. The basic explanation of the IOM signal is described in the following short video:

The result of the IOM signal, it’s a very visual representation about the distribution of token holder positions across the price spectrum. I believe that part of the popularity of the IOM signal is that analysts immediately get an intuitive representation of the positions of investors in a crypto-asset. To put this in perspective, compare the following IOM analysis for Bitcoin and Ethereum and see if you don’t get an immediate idea of what asset you would rather invest on today. 😉

Despite the popularity of the IOM signal, I am more interested in many other revelations of the analysis that are not very obvious at first glance. Let’s review a few of my favorites.

Objective Support-Resistance Levels

The clusters closer to the price level act can be used as a quantifiable factor to estimate levels of support and resistance for a crypto-asset. For instance, the following IOM result for Ethereum shows that the cryptocurrency has a massive level of resistance around the $170 price mark with over 3 million addresses holding positions at those levels.

Momentum

The momentum factors is one of the key pillars of modern quantitative finance. Conceptually, momentum-drive thesis tend to look for factors that can indicate strong performance of the asset in the near future. Measuring the percentage of address in-the-money over different periods of time can be used as a momentum signals like shown in the following chart.

IOM_Momentum_Factor= f({iom1, iom2, …, iomn}, {t1, t2, …, tn}

Value

It’s hard to come up with quantifiable and consistent measures of value for crypto-assets. However, understanding the percentage of “active addresses in-the-money“ compared to the current price. For instance, a crypto-asset that has a larger number of addresses in-the-money relative to the current price could be more valuable with other crypto-assets with a smaller ratio.

IOM_Value_Factor= f(Active_InTheMoney_Addresses, Price)

Risk

Risk is typically associated with positions that can signal negative conditions in the market. Volatility is considered the cornerstone of risk factors but cryptocurrencies introduce their own flavors. Using the IOM analysis, we can model a risk factor using the number of out-of-the-money addresses relative to the current price. In that context, crypto assets with a larger percentage of out of the money address relative to the current price could be consider riskier.

IOM_Risk_Factor= f(Active_OutOfTheMoney_Addresses, Price)

Another risk factor could be the ratio between active in_the_money and out_of_the_money addresses. That factor should be linearly proportional to the level of risk in a crypto asset.

IOM_Risk_Factor= f(Active_Out_Of_The_Money_ Addresses, Active_In_The_Money_Addresses)

Behavioral

Finally, the IOM analysis reveals fascinating insights about the behavior of individual investors in a crypto asset. Those insights can be extrapolated to infer behavioral economic signals about the investors in a given crypto assets. Let’s illustrate this using two of the best-known patterns of behavioral economics.

Overconfidence

In behavioral finance, overconfidence refers to the tendency of investors realizing gains to take more aggressive bets that are not exactly correlated to the state of the market.

In the case of the IOM analysis, we can define an overconfidence factor as the number of addresses that are realizing gains and are actively trading.

Loss Aversion

In behavioral finance, loss aversion refers to people’s tendency to prefer avoiding losses to acquiring equivalent gains.

We could estimate a similar factor using the IOM analysis and, specifically the number of out_of_the_money addresses. Essentially an address can be said to be averse to loss if is out_of_the_money and hasn’t traded for some period of time.

These are some of the hidden gems we can uncover leveraging the IOM signals in the IntoTheBlock platform. Understanding the statistical distribution of the positions of individual investors opens the door to fascinating insights about crypto assets that are nearly impossible to replicate in other asset classes.