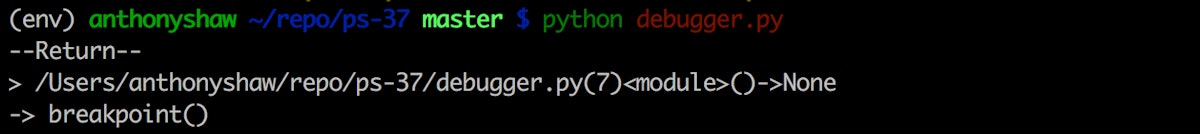
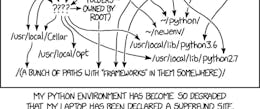
Debugging in Python has always felt a bit “awkward” compared with other languages I’ve worked in. Most developers import the module from the standard library and run which enters an interactive debugging session in the console when executed. pdb pdb.set_trace() There are some important issues with this approach: Writing is a little obtuse. Once you’ve typed it 100 times it goes into muscle memory but for new developers it’s not obvious. import pdb; pdb.set_trace() PDB is not the only debugger, it’s also the most basic. There are plenty of better options. What happens if you’re not writing a console app? What if the breakpoint get’s hit on a server, or a threaded task, where is the debugging session? Python 3.7 implements PEP553, a new way of inserting breakpoints in your code. The new breakpoint method OK, first breakpoint is a and NOT a keyword. function So just putting on the line of code you want to break on does nothing. You need to call it as a method, ie. breakpoint breakpoint() The default implementation of breakpoint will and call . import pdb pdb.set_trace() Yields a pdb session on the command line. So this is already a lot more intuitive that current versions of Python. But wait, there’s more The new breakpoint method can be disabled using the PYTHONBREAKPOINT environment variable. So if you do leave breakpoints in your code and you want to execute it just once without having them stall execution. You can set the environment value to 0. PYTHONBREAKPOINT=0 python3.7 debugger.py Calling the same script again just completes execution and skips calling the breakpoint. But wait, there’s more! The environment variable can be set to the of a callable. This can be the callable that starts a debugging session in another 3rd party debugger library. PYTHONBREAKPOINT name is one such library. Pudb is an interactive console debugger with similar key mappings as pdb, but just so much easier to work with. has been around for ages, supported in Python 2 and 3. pudb pudb To use as your debugger, first make sure you have installed it, and then set the environment variable to . pudb pip install pudb pudb.set_trace Calling this on the command line: PYTHONBREAKPOINT=pudb.set_trace python3.7 debugger.py Is the equivalent to replacing the method with breakpoint() import pudb; pudb.set_trace() Pretty neat. What about remote debugging and threads? This new breakpoint feature opens up an interesting use case. Whilst you’re developing an application for distribution across multiple servers or threads, you can use a local debugger, like pudb. When you deploy to a testing environment, you likely aren’t executing from the cli. You’re calling from gevent or WSGI etc. This is when you change the environment variable in your web service or test environment to another debugger that allows remote connections. One such package you could use is . Web-pdb is a remote debugger that starts a web server when the breakpoint hits and you can remotely connect via a browser and interactively debug the session. web-pdb If you then you can set now when the function is called (no matter if it’s in a background process) you can connect to the service locally by default on port 5555 and you’ll be greeted with this interface. pip install web-pdb export PYTHONBREAKPOINT=’web_pdb.set_trace’ breakpoint() Still stuck on Python 2? Check out my new course on Pluralsight for moving from Python 2 to 3.