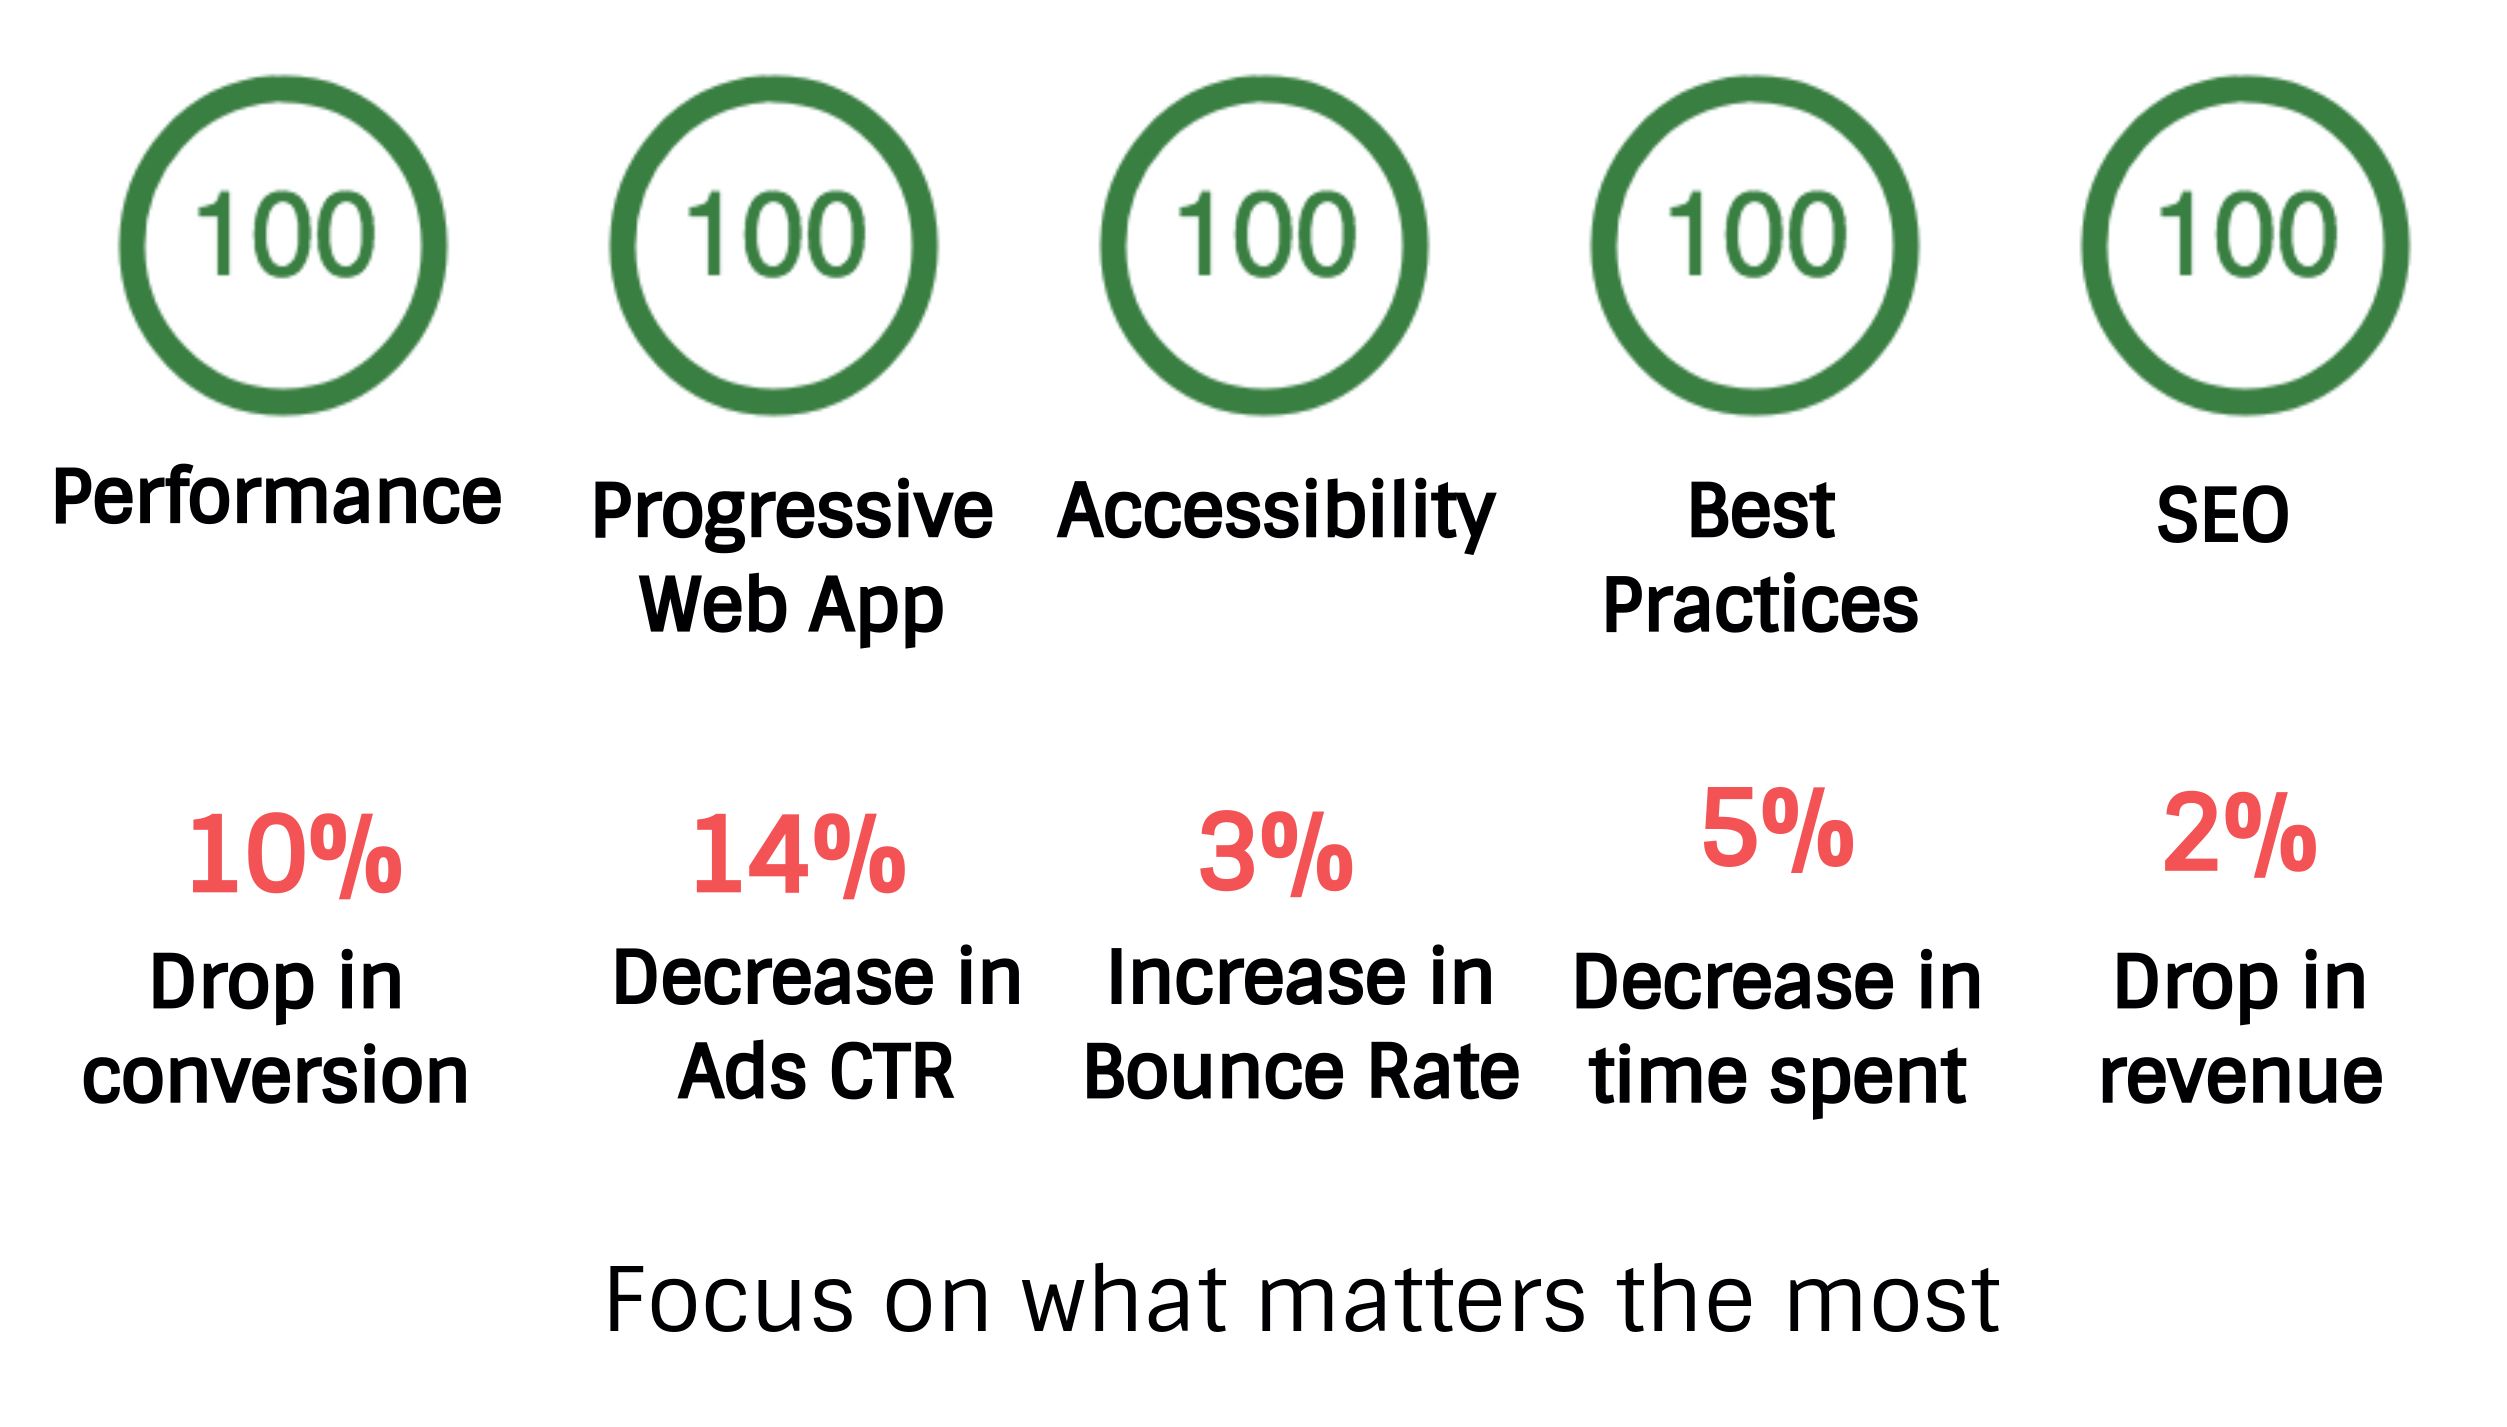
When someone starts looking for optimizing the performance of their web application they immediately come across this tool called lighthouse by Google.
Lighthouse is an awesome tool to quickly find out the performance issues in your web application and list down all the actionable items. This list helps you quickly fix the issues and see the green color performance score on your lighthouse report. With time lighthouse has become a defacto standard for web performance measurement and Google is pushing it everywhere from chrome dev tools to browser extensions, page speed insight to web.dev, and even webmaster search console. Anywhere if you talk about performance you will see the lighthouse auditing tool.
This article will cover the usage of the lighthouse and its strengths and weaknesses. Where to trust it and where to not. Google has eagerly advertised all the benefits of the tools and integrated it in all of its other major tools like search console, page speed insight, and web.dev. This directly or indirectly forces people to improve their score sometime at the cost of something important. Many teams do weird things to see green ticks in their lighthouse report without knowing the exact impact of it on their conversion and usability.
Lighthouse has made it very easy to generate your site performance report. Just open your site, go to dev-tools click Audit Tab, and run the test. Boom you got the results. But wait can you trust the score you just got the answer to this is a big no. Your results vary a lot when they are executed on a high-end machine vs when executed on a low-end machine because of different available CPU cycles to the lighthouse process. You can check the CPU/Memory power available to the Lighthouse process during the test at the bottom of your lighthouse report.
The Lighthouse team has done a great job in throttling the CPU to bring computation cycles down to an average of most used devices like MOTO G4 or Nexus 5X. But on a very high-end machine like new fancy MacBook Pro throttling CPU cycles does not drop CPU cycles to the desired level.
For example
Let a high-end processor like Intel i7 can execute 1200 instructions in a sec by throttling it 4x only 300 instructions will get executed.
Similarly, a low-end processor like intel i3 can only execute 400 instructions in a sec and by throttling it to 4x only 100 instructions can get executed.
It means everything on intel i7 or any other higher-end processor will be executed faster and will result in much better scores. One of the critical matrices in the lighthouse is TBT (Total Blocking Time) which depends heavily on CPU availability. High CPU availability ensures a fewer number of long tasks (tasks which take more than 50ms) and less the number of long tasks lower is the TBT value and higher is the performance score.
This is not the only problem, lighthouse scores can differ between multiple executions on the same machine. This is because lighthouse or in fact any application cannot control the CPU cycles as this is the job of the operating system. The operating system decides which process will get how many computation cycles and can reduce or increase CPU availability based on a number of factors like CPU temperature, other high priority tasks, etc.
Below are the lighthouse scores on the same machine when the lighthouse is executed 5 times for housing.com once serially and once in parallel. When executed serially results are completely different than when run in parallel. This is because available CPU cycles from the operating system get distributed to all 5 processes when run in parallel and are available to a single process when executed in serial.
When the lighthouse is executed 5 times on the housing home page serially using the below code
let numberOfTests = 5;
let url = 'https://housing.com';
let resultsArray = [];
(async function tests() {
for(let i =1;i <= numberOfTests; i++) {
let results = await launchChromeAndRunLighthouse(url, opts)
let score = results.categories.performance.score*100;
resultsArray.push(score);
}
console.log(median(resultsArray));
console.log(resultsArray);
}());
Median is 84
[ 83, 83, 84, 84, 85]
The results are pretty much consistent.
When the same test is executed in parallel.
const exec = require('child_process').exec;
const lighthouseCli = require.resolve('lighthouse/lighthouse-cli');
const {computeMedianRun as median} = require('lighthouse/lighthouse-core/lib/median-run.js');
let results = [], j=0;
for (let i = 0; i < 5; i++) {
exec(`node ${lighthouseCli}
https://housing.com
--output=json`, (e, stdout, stderr) => {
j++;
results.push(JSON.parse(stdout).categories.performance.score);
if(j === 5) {
console.log(median(results));
console.log(results);
}
});
}
Median is 26
[ 22, 25, 26, 36, 36 ]
You can clearly see the difference in scores between the two approaches.
This is the most complex issue with lighthouse reporting. Every application is different and optimizes the available resource where it sees the best fit.
Gmail is the best example of this case. It prioritizes emails over any other things and mails get interactive as soon as the application loads in the browser. Other applications like Calendar, Peak, Chat, Tasks keep loading in the background.
If you will open the dev tools when Gmail is loading you might get a heart attack seeing the number of requests it makes to its servers. Calendar, Chat, Peak, etc. adds too much to its application payload but Gmail’s entire focus is on emails. Lighthouse fails to understand that and gives a very pathetic score to Gmail applications.
There are many similar applications like Twitter, Revamped version of Facebook which has worked extensively on performance but lighthouse mark them as poor performance applications.
All of these companies have some of the best brains who very well understand the limitations of the tool so they know what to fix and what aspects to be ignored from lighthouse suggestions. The problem is with organizations that do not have resources to and time to explore and understand these limitations.
Search google for “perfect lighthouse score” and you will find 100’s of blogs explaining how to achieve 100 on the lighthouse. Most of them have never checked other critical metrics like conversion or Bounce rate.
One big issue with Google’s integration of lighthouses is that these tools are mostly used by non-technology people. Google search console which helps in analyzing the site’s position in the google search result is mostly used by marketing teams.
Marketing teams report performance issues reported in the search console to higher management who do not understand the limitations of the tool and force the tech team to improve performance at any cost (as it may bring more traffic).
Now the tech team has two options either to push back and explain limitations of the tool to higher management which happens rarely or take bad decisions that may impact other critical metrics like conversion, bounce rate, etc. Many large companies lack processes to regularly check these crucial metrics.
The only solution to this issue is to measure more and regularly. Define core metrics your organization is concerned about and prioritize them properly. Performance has no meaning if it is at the cost of your core metrics like conversion.
Inconsistency in lighthouse scores cannot be solved with 100% accuracy but can be controlled to a greater extent.
Cloud services are again an awesome way to test your site quickly and get a basic performance idea. Some of the google implementations like page speed insight tries to limit the inconsistency by including lighthouse lab data and field data (Google tracks the performance score of all sites you visit if you allow Google to sync your history). Webpagetest queue the test request to control CPU cycles.
But again they also have their own limitations.
You will be amazed by seeing the delta between minimum and maximum of ten test runs of a single page on web.dev. Prefer to take the median of all results or remove the outliers and take avg of the remaining tests.
The Lighthouse team has again done a great job here by providing a CI layer for self hoisting. The product is lighthouse-ci (https://github.com/GoogleChrome/lighthouse-ci).
This is an amazing tool that can be integrated with your CI Provider (Github Actions, Jenkins, Travis, etc) and you can configure it as per your needs. You can check the performance diff between two commits, Trigger lighthouse test on your new PR request. Create a docker instance of it, this is a way where you can control CPU availability to some extent and get consistent results. We are doing this at housing.com and pretty much happy with the consistency of results.
The only problem with this approach is It is too complex to set up. We have wasted weeks to understand what exactly is going on. Documentation needs a lot of improvement and the process of integration should be simplified.
Web vitals are core performance metrics provided by chrome performance API and have a clear mapping with the lighthouse. It is used to track field data. Send data tracked to GA or any other tool you use for that sake. We are using perfume.js as it provides more metrics we are interested in along with all metrics supported by web vitals.
This is the most consistent and reliable among all the other approaches as It is the average performance score of your entire user base. We are able to make huge progress in optimizing our application by validating this data.
We worked on improving our Total Blocking Time(TBT) and the Largest Contentful Paint(LCP) after identifying problem areas. We improved TBT by at least 60% and LCP by 20%.
TBT improvements Graph
CLS improvements graph
The above improvements were only possible because we were measuring things. Measuring your critical metrics is the only way to maintain the right balance between performance, conversion, etc. Measuring will help you know when performance improvement is helping your business and when it is creating problems.
Developers apply all sorts of tricks to improve their lighthouse scores. From lazy loading offscreen content to delaying some critical third-party scripts. In most cases, developers do not measure the impact of their change on user experience or the users lost by the marketing team.
Lighthouse performance scores mostly depend upon the three parameters
To improve your performance score, the lighthouse report provides tons of suggestions. You need to understand the suggestions and check how feasible they are and how much value those suggestions will bring to your website.
Let us take a few suggestions from each category of the lighthouse report and see what are the hidden cost of implementing them.
Lighthouse suggests optimizing images by using modern image formats such as webp or avif and also resizing them to the dimension of the image container. This is a very cool optimization and can have a huge impact on your LCP score. You can enhance it further by preloading first fold images or serving them via server push.
To build a system where images are resized on the fly or pre resized to multiple possible dimensions on upload is a tedious task. In both ways, depending upon your scale you might need to take a huge infra burden that needs to be maintained and also continuously invest.
A better approach is to implement it on a single page for a limited image and track your most critical metrics like conversion, bounce rate, etc. And if you are really happy with the ROI then take it to live for all of your images.
Lighthouse recommends reducing your Javascript, CSS size as much as possible. Javascript or CSS execution can choke the main thread and CPU will be unavailable for more important stuff like handling user interaction. This is a fair idea and most people understand the limitation of js being single-threaded.
But Google took the wrong path here. In the upcoming version, the lighthouse will start suggesting the replacement of larger libraries with their smaller counterparts. There are multiple problems with this approach.
Google should learn from this famous quote
“Be the change that you wish to see in the world.”
- Mahatma Gandhi
Before taking any step to reducing javascript on your page like lazy loading off-screen components please calculate its impact on your primary metrics like conversion, user experience, etc.
Every website must try to avoid any kind of layout shift which may cause issues in user experience. But there will be cases where you will not have many options to avoid CLS.
Let a website want to promote app downloads to users who have already not installed the app. Chrome has added support to detect if your app is already installed on the device(using getInstalledRelatedApps API) but this information is not available to the server on the first request.
What the server can do is make a guess and decide if it needs to append the app download banner on the page or not. If the server decides to add it and the app is already present on the device, the Download banner needs to be removed from the page and similarly when the server decides to not include the download banner and the app is already not installed on the device it will be appended to the DOM on the client which will trigger Cumulative layout shift(CLS).
To avoid CLS you will remove the banner from the main layer of the page and show it as a modal, floating element or find some other way to show it, but what if you get maximum downloads when the banner is part of your page. Where will you compromise?
On a funny note, Most of the people have already experienced CLS on the google search result page.
Also published at https://ashu.online/blogs/lighthouse-performance-auditing-things-you-should-know