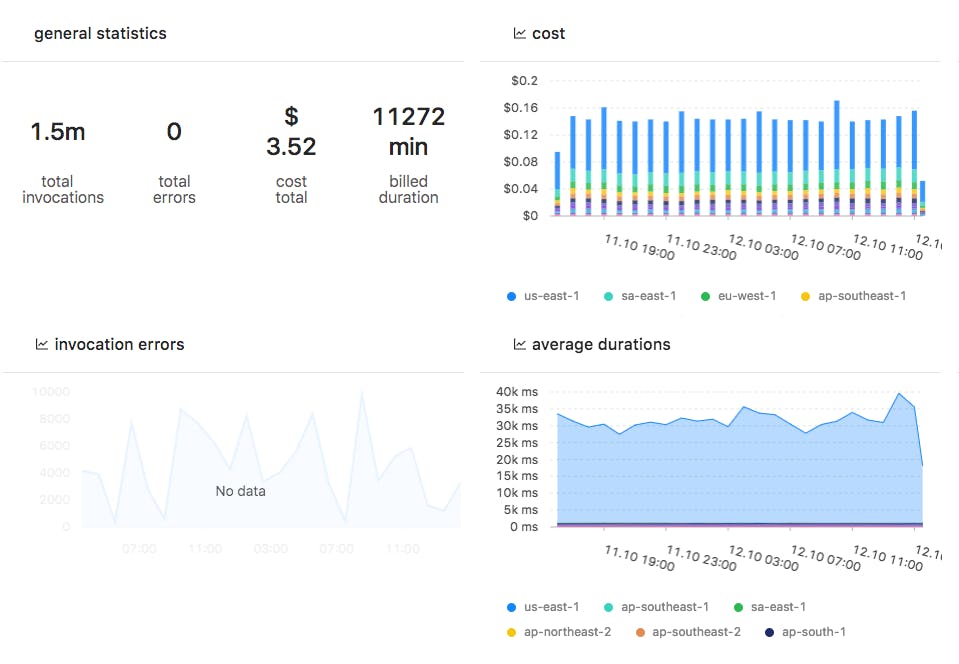
For the past two years, I have focused most of my time and energy on building applications. The culmination? Me and my friend founded . Before starting , we built serverless solutions in Testlio — a crowd sourced QA company. Today, both of these services heavily use Lambda functions. Serverless Dashbird — a monitoring and error alerting service for AWS Lambda Dashbird There are many areas in serverless that I would like to cover, but I’ll focus on the elephant in the room: . I think it’s one of the biggest problems in the serverless space while also being the area I consider my expertise to be the most impactful. monitoring and getting insights into Lambda functions Figuring out monitoring… When adopting serverless, we had to re-imagine our approach on obtaining and displaying application metrics. We wanted to keep our functions clean and simple — . We also wanted everything to be observable through a — a feature that existing APMs were lacking. And most of all, we wanted the ability to find and , including logs and context, to troubleshoot and debug code when something went haywire. no third-party agents and wrappers single dashboard drill down into invocation level data Today, I can say that we are pretty close to that level of visibility and I want to share my experience and take-aways of how we got there. Get EVERYTHING from logs! Analysing logs is an extremely powerful way of gathering information and there isn’t much you can’t do with it. But with Lambda, you can take this to a whole new level. Let me explain. CloudWatch organises logs based on function, version and containers while Lambda adds metadata for each invocation. In addition, runtime and container errors are included in the logs. And of course, you can log out any custom metric and have it turned into time-series graphs. It’s not a job for CloudWatch, though. Log Stream history of a Lambda function. Lets break this down. Generally speaking, there are two angles for monitoring an application. (like latency, errors, invocations and memory usage) and , like the number of signups or emails sent. System metrics business analytics Technical performance metrics and error detection is pretty universal and that is what Dashbird is meant to be — a plug and play monitoring service. Business metrics, however, vary from service to service and need a custom approach. Our weapon of choice for that is SumoLogic, but you can use other services like Logs.io etc. Let’s tackle system metrics first… Time to get REAL insights into your Lambdas We built to get visibility into technical metrics of serverless architectures. It works by collecting and analysing CloudWatch logs in real-time. Dashbird With all good monitoring services, it’s important to get an overview on a single screen. The main page is designed to do just that. It includes an overview of all invocations, top active functions, recent errors and system health. It’s supposed to tell you if and where you have problems. From there, you can go down to Lambda view and analyse each function individually. Time-series metrics allow optimisation This view enables developers to judge latency and memory usage. We use it to optimise functions for cost efficiency by adjusting the provisioned memory to match the actual usage. Alternatively, it’s useful for speeding up endpoints . by adding more memory For troubleshooting and fixing problems, we rely on the failure recognition in logs. In our experience, this approach is just right for Lambda functions. Here are some of the reasons: because execution gets killed from the lower layer before the library has time to send an alert. Timeouts never reach alerting services, , because the execution halts at container startup. Configuration failures never reach alerting services Some functions you don’t expect to fail, so you don’t add alerting for them. Sometimes they still fail though. Less blind spots. , meaning we know what happened before the crash. Stacktraces are to be connected to execution logs Here’s what debugging looks like 😎. What should I log? The story doesn’t end there here. Regardless of all the fancy graphs, I’ve still found myself clueless of what happened more times than I’d like to admit. Merely a stack-trace might not be enough to understand the details of a failed execution (especially with Node.js’s fuzzy traces). For that, we’ve developed some conventions for logging in Lambda functions. We always log out: ( like passwords, credit card details, etc) event object omit sensitive information (if you an error, add a ) errors and exceptions try…catch console.log(error) (it’s infuriating to spend hours debugging your code, only to find out that a remote endpoint changed it’s response body_)_ everything that looks fishy (these go up in a custom dashboard in a minute) events with business value Collecting business metrics Business analytics follow the same basic idea. Our weapon of choice is . SumoLogic SumoLogic is a machine data analytics service for log management and time series metrics. What’s great about the service is the ability to construct custom dashboard out of pretty much anything. The setup is a bit different from Dashbird but it’s just as awesome. Here’s a that subscribes to a log group and sends logs to the service 😎. lambda function Building a custom metrics dashboard There isn’t as much convention and common ground in custom metrics, so we’re going to play this through with an example. I’m going to demonstrate how we gathered metrics for an integration service. The service has the task on syncing issues between issue-tracker accounts (think JIRA and Asana). We wanted to log out all CRUD actions against client issue-trackers. For that, let’s add a log line for each time a request of this sort is made: console.log(`-metrics.integrations.${env.STAGE}.crud.${method}`); Now we have the ability to turn these events into time-series metrics. Let’s query this… "-metrics.integrations.prod.crud." | parse "-metrics.integrations.prod.crud.*" as method | timeslice 5m | count(method) group by _timeslice, method | transpose row _timeslice column method and see what we get… Nice! Add that to your dashboard. Now make it observable. With any dashboard, it’s important to get an overview at a glance. A rule of thumb with dashboards is you need to able to say in 5 seconds, if something is wrong. We try to represent failures in number and expected events in time-series metrics. Here’s what we ended up with our integration-service dashboard. It’s still work in progress, as we’re testing between ways to display information. Conclusion The short-lived, parallel and highly scalable nature of Lambda forced us to innovate and be creative. The aforementioned approach has helped us bring clarity and visibility into our serverless systems, and I have seen it having a similar effect for other teams. Both of the tools have a free tier version, so you can easily try them out. PS. If you have alternative ideas or would like to share your work in the monitoring field, please let me know in the comments.