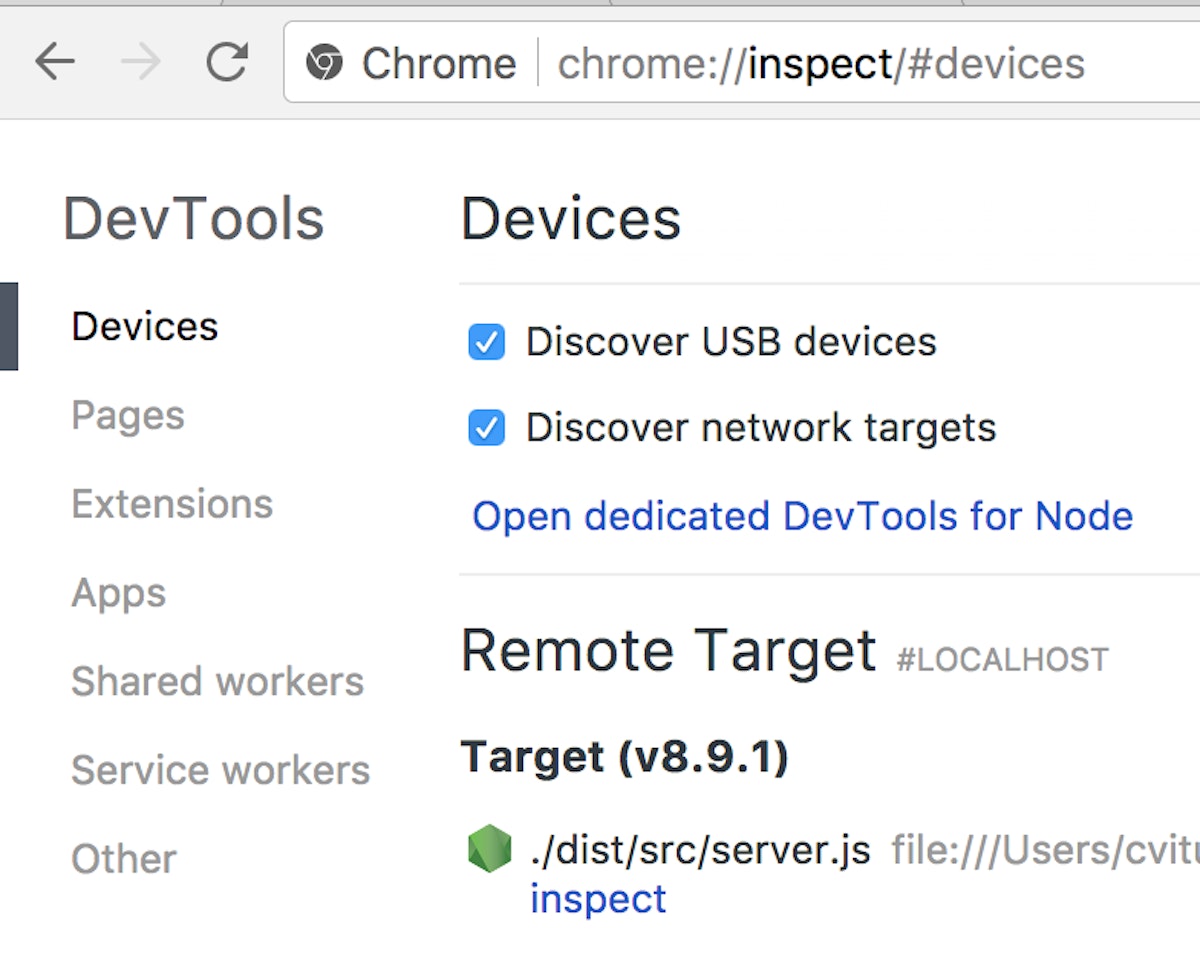
I’m typically a frontend developer, but every now and then I find myself writing or maintaining some backend code. One of the most significant drawbacks I’ve encountered when switching contexts to Node is the lack of the Chrome Developer Tools. Not having them really highlights how hard I lean on them during my day to day in web development. Luckily, there are options for enabling them, and they’ve gotten much more stable and usable in recent times. Node has a built in debug mode that allows you to connect to the DevTools, and there’s a package called that connects automatically. node-inspector It’s worth noting that versions of Node < 8 use a now-legacy Debugger API. Node 8 introduces the Inspector API, which better integrates with existing developer tools. There’s one common theme that I’ve encountered when using these methods: they must be invoked when starting the node process. The other day, I found myself with a process in an odd state that I’ve had trouble reproducing, and I didn’t want to risk losing it by restarting the process to enable the inspector. However, I found a solution — no less, a solution from . the official Node docs A Node.js process started without inspect can also be instructed to start listening for debugging messages by signaling it with SIGUSR1 (on Linux and OS X). This only applies to unix based OSes (sorry Windows users), but it saved my bacon in this case. The command in unix may be ominously named, but it can also be used to send arbitrary signals to a running process. tells me that I can do so using the syntax, . The list of signal names can be enumerated with , shown below. kill man kill kill -signal_name pid kill -l $ kill -lhup int quit ill trap abrt emt fpe kill bus segv sys pipe alrm term urgstop tstp cont chld ttin ttou io xcpu xfsz vtalrm prof winch info usr1 usr2 By default, sends an , or an errupt signal, which is equivalent to hitting in a terminal window. There’s a lot of depth to process signals that I won’t get into (I encourage you to explore them!), but towards the end of the list is . This is the that the node docs are referring to, so now I just need a pid, or process ID, to send it to. I can find that by using and to narrow the list of all processing running on my system kill int int ctrl-c usr1 SIGUSR1 ps grep $ ps | grep node9670 ttys000 0:01.04 node /snip/.bin/concurrently npm run watch:server npm run watch:client9673 ttys000 0:00.46 node /snip/.bin/concurrently npm run watch:server-files npm run watch:dist9674 ttys000 0:33.02 node /snip/.bin/webpack — watch9677 ttys000 0:00.36 node /snip/.bin/concurrently npm run build:snip — — watch9678 ttys000 0:01.65 node /snip/.bin/nodemon — delay 2 — watch dist ./dist/src/server.js9713 ttys000 0:01.00 /usr/local/bin/node ./dist/src/server.js9736 ttys003 0:00.00 grep — color=auto node My output is a little noisy due to a complex build toolchain that spawns many processes. But I see down towards the bottom the right process: , with a pid of . node ./dist/src/server.js 9713 Now I know the signal name is and the pid is , so I need to run. usr1 9713 $ kill -usr1 9713 It runs with no output, but I check the logs of my node process and see Debugger listening on ws://127.0.0.1:9229/ad014904-c9be-4288–82da-bdd47be8283bFor help see https://nodejs.org/en/docs/inspector I can open , and I immediately see my inspect target. chrome://inspect I click “inspect”, and I’m rewarded with a Chrome DevTools window in the context of my node process! I can use the profiler to audit performance, use the source tab to add break points and inspect the running code, and use the console to view logs or modify the variables in the current scope, just like I would on the web. I’m also on where I mostly tweet tech stuff, and , where I answer questions about React. I also moderate , a sister server for node developers. Twitter Reactiflux Nodeiflux