paint-brush
Data Visualizationby@afroz-chakure
543 reads
543 reads

Data Visualization

by Afroz ChakureAugust 9th, 2019
Read on Terminal Reader
Read this story w/o Javascript
tldt arrow

Too Long; Didn't Read

We'll be implementing various data visualization techniques on the 'iris' dataset. The most common types of plots used in data visualization: Scatter plots, Box plots and Violin plots. The code for pair plots is simple and as follows: The code is simple for plotting the features using Box plots. We'll use matplotlib, Seaborn and lmplot libraries for data visualization. The dataframe is a dataframe and the dataframe will be transformed into a real world dataframe.

Company Mentioned

Mention Thumbnail
featured image - Data Visualization
Afroz Chakure HackerNoon profile picture

What is Data Visualization ?

Data visualization is a form of visual communication. It involves the creation and study of the visual representation of data.

We'll be implementing various data visualization techniques on the 'iris' dataset.

Different types of analysis:

  1. Univariate (U) : In univariate analysis we use a single feature to analyze its properties.
  2. Bivariate (B): When we compare the data between exactly 2 features then its called bivariate analysis.
  3. Multivariate (M): Comparing more than 2 variables is called as Multivariate analysis.

Most common types of plots used in data visualization:

  1. Scatter plot (B)
  2. Pair plot (M)
  3. Box plot (U)
  4. Violin plot(U)
  5. Distribution plot (U)
  6. Joint plot (U) & (B)
  7. Bar chart (B)
  8. Line plot (B)

Let us look at some of these plots used in data visualization one by one :

Import libraries for data visualization

First we need to import two important libraries for data visualization -

  1. matplotlib
  2. seaborn

Matplotlib is a python library used extensively for the visualization of data. While Seaborn is a python library based on matplotlib. Seaborn provides a high-level interface for drawing attractive and informative statistical graphics.

import matplotlib.pyplot as plt
import seaborn as sns

Load file into a dataframe

iris = pd.read_csv("iris.csv")

1. Scatter Plot:

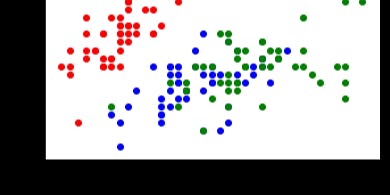
It is one of the most commonly used plots for simple data visualization. It gives us a representation of where each point in the entire dataset are present with respect to any 2 or 3 features (or columns). They are available in 2D as well as 3D.

# Here we are plotting sepal_length vs sepal_width 
# setosa - 'red'; versicolor - 'blue'; virginica - 'green'
for n in range(0,150):
    if iris['species'][n] == 'setosa':
        plt.scatter(iris['sepal_length'][n], iris['sepal_width'][n], color = 'red')
        plt.xlabel('sepal_length')
        plt.ylabel('sepal_width')
    elif iris['species'][n] == 'versicolor':
        plt.scatter(iris['sepal_length'][n], iris['sepal_width'][n], color = 'blue')
        plt.xlabel('sepal_length')
        plt.ylabel('sepal_width')
    elif iris['species'][n] == 'virginica':
        plt.scatter(iris['sepal_length'][n], iris['sepal_width'][n], color = 'green')
        plt.xlabel('sepal_length')
        plt.ylabel('sepal_width')

2. Pair Plot

Lets say we have n number of features in a data, Pair plot will help us create us a (n x n) figure where the diagonal plots will be histogram plot of the feature corresponding to that row and rest of the plots are the combination of feature from each row in y axis and feature from each column in x axis.

The code snippet for pair plot implemented on Iris dataset is :

3. Box Plot

A box plot (or box-and-whisker plot) shows the distribution of quantitative data in a way that facilitates comparisons between variables or across levels of a categorical variable. The box shows the quartiles of the dataset while the whiskers extend to show the rest of the distribution.

Code for plotting the features using Box plots :

# Plotting the features using boxes
plt.style.use('ggplot')
plt.subplot(2,2,1)
sns.boxplot(x = 'species', y = 'sepal_length', data = iris)
plt.subplot(2,2,2)
sns.boxplot(x = 'species', y = 'sepal_width', data = iris)
plt.subplot(2,2,3)
sns.boxplot(x = 'species', y = 'petal_length', data = iris)
plt.subplot(2,2,4)
sns.boxplot(x = 'species', y = 'petal_width', data = iris)

4. Violin Plots:

The violin plots can be inferred as a combination of Box plot at the middle and distribution plots (Kernel Density Estimation ) on both side of the data. This can give us the details of distribution like whether the distribution is mutimodal, Skewness etc.

Violin plot is also from seaborn package. The code is simple and as follows.

# Representing data using violin form
plt.style.use('ggplot')
plt.subplot(2,2,1)
sns.violinplot(x = 'species', y = 'sepal_length', data = iris)
plt.subplot(2,2,2)
sns.violinplot(x = 'species', y = 'sepal_width', data = iris)
plt.subplot(2,2,3)
sns.violinplot(x = 'species', y = 'petal_length', data = iris)
plt.subplot(2,2,4)
sns.violinplot(x = 'species', y = 'petal_width', data = iris)

5. Joint Plot

Join plots can do both univariate as well as bivariate analysis. The main plot will give us a bivariate analysis, whereas on the top and right side we will get univariate plots of both the variables that were considered. It makes our job easy by getting both scatter plots for bivariate and Distribution plot for univariate, both in a single plot.

There are variety of option you can choose from, which can be tuned using kind parameter in seaborn’s jointplot function.

# Joint plots shows bivariate scatterplots
# And univariate histograms
sns.jointplot(x = 'sepal_length', y = 'sepal_width', data = iris)

6. Strip Plot

A strip plot can be drawn on its own, but it is also a good complement to a box or violin plot in cases where you want to show all observations along with some representation of the underlying distribution.

It is is a graphical data anlysis technique for summarizing a univariate data set. It is typically used for small data sets (histograms and density plots are typically preferred for larger data sets).

# Plottign data in strip
plt.subplot(2,2,1)
sns.stripplot(x = 'species', y = 'sepal_length', data = iris, jitter = True)
plt.subplot(2,2,2)
sns.stripplot(x = 'species', y = 'sepal_width', data = iris, jitter = True)
plt.subplot(2,2,3)
sns.stripplot(x = 'species', y = 'petal_length', data = iris, jitter = True)
plt.subplot(2,2,4)
sns.stripplot(x = 'species', y = 'petal_width', data = iris, jitter = True)

lmplot() function in seaborn

Seaborn's lmplot is a 2D scatterplot with an optional overlaid regression line. Logistic regression for binary classification is also supported with lmplot . It is intended as a convenient interface to fit regression models across conditional subsets of a dataset. 

The fuction can draw a scatterplot of two variables, x and y, and then fit the regression model y ~ x and plot the resulting regression line with a 95% confidence interval for that regression.

lmplot() has data as a required parameter and the x and y variables must be specified as strings.

# This graph is same as above but plotting the species separately
sns.lmplot(x = 'sepal_length', y = 'sepal_width', data = iris, hue = 'species', col = 'species')

Conclusion :

So here you go, you have learned about the different kinds of plots that you could make using seaborn and matplotlib library. Data visualization not only helps you to understand your data well but whenever you find any insights, you can use these visualization techniques to share your findings with other people.

Now go on and try creating such amazing plots on some real-world data sets.