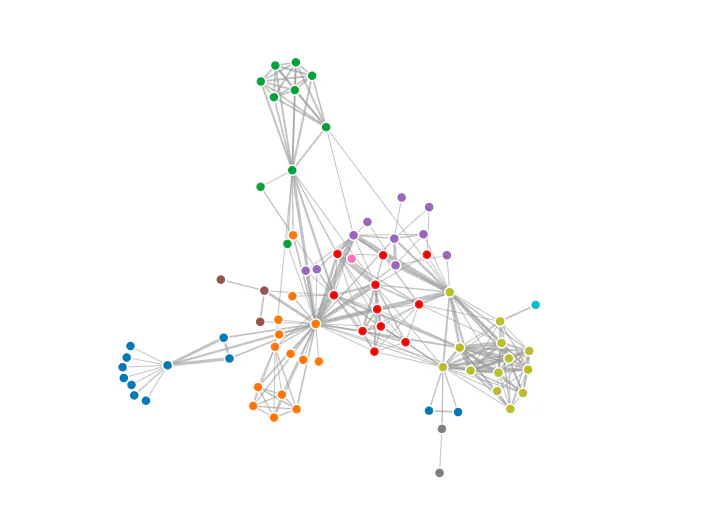
Data visualization is a term used to describe the data that comes in a pictorial or graphical format and aids the decision makers to identify a pattern on the amount of information that comes in. The analytics would be presented visually in some kind of coherent visual order that makes it easier for them to identify the areas that need improvement and help predict sales volume. , also known as D3 or Data Driven Documents is a JavaScript library that produces dynamic and interactive data visualizations. It works well in all modern browsers. D3.js The data is showcased with the help of HTML, SVG and CSS, through D3.js and by binding DOM framework or Document Object Model elements. And, it lets you build the kind of data visualization framework that you need for your project. Free and open source, it was , who wrote D3.js when he was doing his Phd at Stanford Visualization Group. Ever since then, several contributors also joined in and added their bit of components and plugins as well. Mike Bostock A major advantage of D3.js is that it is highly functional, meaning you can reuse the code and add functions relevant to your project. Some of the early graphic tools of D3.js include Prefuse, Flare and Protovis. Flare, an open source, ActionScript library helps you create both basic charts and graphics to complex interactive graphics through visual encoding, interaction tools and animation. Protovis is equipped with a rich set of features and extensive toolkit for data visualization, modelling and interaction. Licensed under BSD, Protovis can be used for both commercial and non-commercial purposes. Prefuse has a toolkit for interactive data visualizations. Data Visualization — Giving a Visual Touch to Data in every business, but when received in the base form, it is useless unless you can make something out of it. When information keeps flowing in, you may need to recognize a pattern that would help make crucial business decisions. This is why relevant and useful data should be converted in the form of plots, graphs and tables. Data is considered as the king In other words, this is called and when it is received in a visually appealing manner, you can recognize useful patterns and trends. But then, that’s not enough. Patterns and insights may turn almost invisible when you scan through the data spreadsheet. But with data visualization, things take a different turn because they can successfully empower decision making. data visualization This helps you solve problems faster and hasten innovation because visualization can help you see bigger picture while tuning out the ones that seem irrelevant. This is why it is already making a huge impression in the world of predictive analytics. Interactive Data Visualization — the Art of Data Storytelling The massive growth in data visualization has led to another thing — the art of storytelling. emerged widely on a global scale and a totally different realm altogether, but that presented a few other challenges that were not properly envisaged earlier. Certain stories just cannot be presented through visual patterns. Data visualization through storytelling Imagine looking at a pie chart with 1000 slices, how would you draw conclusions looking at that? To combat this issue, you can explore the potential of geographic maps, tree maps, network diagrams and infographics. Stakeholders have also accepted the concept and understood the value of storytelling through data visualization because the power of narrative in this manner really resonates with them. Data visualization, when left as it is, cannot be analyzed or predicted. For example, when you see a complex concept with layers of features that you cannot understand, the very idea could turn you off. But when the whole concept is explained through a story, it creates a different scenario altogether. Through the storytelling method, a series of questions or visuals can be created that takes the decision makers to the desired conclusion. In other words, it is like a guided narrative. You connect the data with words and then through a story-like form, it would take you through the analysis process. It gives you a completely different picture of the data and even addresses the different concerns of different users, helping you draw meaningful conclusions. Here is an example of interactive data visualization: Ventusky weather map. Let’s look at how Ventusky makes use of data visualization to draw conclusions on weather conditions. Ventusky is a meteorological company based at Pilsen, Czech and makes predictive analysis by watching the trends in the weather condition. The application makes use of visual data to show the pressure development, wind speed, presence of clouds, precipitation and temperature on different regions of the planet. Launched in 2016, the moving map shows real-time weather conditions and all you need to do is type the location in the search field to collect data. Using this data, the weather forecaster can made predictions on the weather, pressure formations and other atmospheric conditions in real-time. Bar charts, pie charts, scatter plots, heat maps, steam graphs are just a few of the forms of data visualization techniques that would help you create deep insights. Out of all these, interactive data visualization is the most appealing. Let’s examine the “why” of it. Why Use D3.js for Data Visualization? D3.js being an open source library allows you to integrate your own code to the code samples already existing in the framework and this would help you build your own diagrams with the already existing charting library. Additionally, there is a gallery with unique charts that would help you develop your own charts using the codes available in the framework library. Thanks to its neat documentation and absence of restrictions, accessing D3.js framework library becomes easier for all available functions. Take a look at some of the advantages of D3.js and you will know why it is so much powerful than other libraries. — D3.js is integrated with a huge repository of examples and an impressive documentation of codes and functions. Free and Open source — D3.js is so flexible, it can work seamlessly with existing web technologies, it lets you manipulate any part of the DOM and provides the same kind of flexibility offered by other technology stacks like HTML, CSS and SVG. Superb Flexibility — As it is fast and responsive, D3.js lets you create dynamic animations in the web browsers. And being both dynamic and interactive, D3.js allows you to explore the data for yourself, using your creativity and skills. Since DOM is also dynamic, you can add or remove the classes and IDs any time you want. Highly Dynamic — When compared to other data libraries, D3.js lets you handle huge amounts of data with ease, freeing up time and resources. Can Handle Huge Amounts of Data — With the various customization options, D3.js lets you create custom codes that give you the freedom to experiment as well. Helps in Writing Custom Code — D3.js comes with a huge collection of plugins so you can use that instead of the plugins that come with proprietary software on devices. Rich Array of Plugins — The functional style of D3.js and the diverse collection of components and plugins allow you to reuse the codes. Re-usable Code Properties of D3.js D3.js is lightning fast, and allows for effective manipulation of documents dynamically and with flexibility, through a number of properties. Have a look at the main properties of D3.js. 1. Selections Selections play a very important role in coding while using D3.js. You need to use this property for changing or modifying any d3 elements with the codes relevant to them. With selectors, you can change the attributes and styles of elements, including the colors. For example, in a circle selection, select the circle that you need to change; this would give the D3 variable a circle element in which you can change the style and attributes. The code for changing or modifying an element’s attributes is .attr() . And the CSS styling of the selected element can be changed through .style()method. d3.selectAll("p") //select all <p> elements.style("color", "lavender") // set style "color" to value "lavender".attr("class", "squares") // set attribute "class" to value "squares".attr("x", 50) // set attribute "x" (horizontal position) to value 50 px Credits: Wikipedia This is just a very basic method of using .attr() and .style(). You can explore various options by combining these two with data binding and mouse events. 2. Transitions Transitions is a term you must all be familiar with. Transitions in D3.js aims for a eye pleasing effect while updating the visual elements. All you need to do is add “transition()”operator to your selection and you can add transitions. It is also possible to set the delay by using the operator .delay() and duration of the transition using .duration()and you can set the parameters as well. For example, the following code snippet helps you to resize the circles in a bubble map with a staggered delay: d3.selectAll(“circle”).transition() .duration(750) .delay(function(d, i) { return i * 10; }) .attr(“r”, function(d) { return Math.sqrt(d * scale); }); Credits: D3.js 3. Enter and Exit Just as the name suggests, the Enter and Exit selections of D3.js is meant for new nodes of data that is coming in and removing the data is no longer needed (also called outgoing nodes). Default selection is available, so even if you forget about the enter and exit selections, it would be alright. For example, d3.select(“body”) .selectAll(“p”) .data([4, 8, 15, 16, 23, 42]) .enter().append(“p”) .text(function(d) { return “I’m number “ + d + “!”; }); Credits: D3.js 4. Data Binding Binding of joining data to DOM framework is another property of D3.js. First, you need to determine what data you will be using in the visualization and then this data would be passed in the form of an array or object. Next, you will be binding the data to whichever type of DOM element you specified in the selectAll() // Create SVG elements from data svg.selectAll(“circle”)// create virtual circle template .data(data)// bind data .enter()// for each row in data… .append(“circle”)// bind circle & data row such that… .attr(“id”, function(d) { return d.name })// set the circle’s id according to the country name .attr(“cx”, function(d) { return d.income /1000 })// set the circle’s horizontal position according to income .attr(“cy”, function(d) { return d.life })// set the circle’s vertical position according to life expectancy .attr(“r”, function(d) { return d.pop /1000 *2 })// set the circle’s radius according to country’s population .attr(“fill”,function(d){ return d.color }); // set the circle’s color according to country’s color Credits: Wikipedia Interesting Visualizations using D3.js Powerful and dynamic visualizations are possible with D3.js. And thanks to the framework being fully capable of working with modern browsers, you no longer have to be worried about the limitations of a proprietary framework. This lets you combine powerful visualization components with data and create something different and unique each time. Here are a few examples of exactly what we are talking about: Geographical Web Maps Source : U.S. Population Density — bl.ocks.org With D3’s data visualization library, you can develop an incredible, interactive and animated web map in Javascript with features in EcmaScript. There are some common geographic projects that come in-built with D3 like the Albers, Gnomic and Mercator. You can also use extended geographic projections plugin and the polyhedral projection plugin for additional geographical projections. Besides these, there are a host of other geographic data visualization plugins that lets you explore the immense possibilities open with D3. You can create a that works with D3 for generating the necessary SVG path instructions. The geospatial data interchange format, GeoJSON is based on the JavaScript Object Notation, and with D3, it is possible to create both simple and complicated graphs. GeoJSON You can also generate Maps using D3.js. TopoJSON eliminates redundancy and helps you to make very precise maps by encoding the coordinates. As it is on a magnitude smaller than GeoJSON files, it goes deeper and more accurate. TopoJSON Bubble Charts Source: MindGapper.js Using D3.js to visualize your data in the form of a bubble chart is a very popular form of expression. Bubble charts can encode data in the form of circles. The benefit of bubble charts is that it can pack in a tremendous amount of information within them. The use of bubbles can enhance the visual appeal of your chart and when you need to spice it up with colors and a dynamic number of categories, you don’t have to worry about new co-ordinates. FishEye Distortions Source: Fisheye Distortion When you distort part of the visuals, you can resort to fisheye distortion. When you have lots of complex graphics to share and the graph becomes too big and overloaded, you can consider converting it into a fisheye distortion. In this manner, you are able to zoom into a particular piece of information and focus that in great detail. The surrounding environment will remain the same, unaffected. There are two different kinds of fisheye distortions that you can try — Circular distortion and Cartesian distortion (mainly for grid lines). Both these are functional and aesthetic and would be a perfect choice for data sets with plenty of information. Treemaps Source: bl.ocks.org Data visualization is made quick and easy with treemaps. Treemaps are one way to make use of available space, by eliminating white spaces (like the kind of space you normally see in Pie charts) and showing your dataset in totality. Even small data points are made easily visible because the visualization technique allows you to take the entire screen space. When utilized in the right way, the treemap can be extremely powerful sources of communicating with your user. Chord Diagrams Source: Chord Diagram — bl.ocks.org Though chord diagrams are a bit difficult to create when data is procured in the raw form, it is still used widely. You need to construct both mapping and matrix in order to render a complete diagram, making it a painstaking chart type to create. This can be done setting arcs on the outside of the diagram and then placing a set of ribbons on the inside. In the D3 code, these arcs are known as groups and the length of the arc would be dependent on the area of circle they occupy. The entire circumference of the circle portrays the sum of the entire matrix and this would be presented in whichever unit you are presenting the information. This would then be subdivided into arcs for each row that you want to represent. Sneak Peek of some Real World Examples Let’s have a look at some of the real world examples of how D3.js form of data visualization is used by some big shots. 1. NY Times: Host of Connections among Oscar contenders Source: The New York Times The power of D3.js is evident in the New York Times. If you look at the image we have shared above, you can see that the team excels in D3.js. The infinite set of graphing and charting is described in the article, “Among the Oscar Contenders, a Host of Connections”, where you can see the actors, directors and producers who have worked for films with Oscar histories. The use of colors, graphics and subtle animations in the chart enhances the information they are trying to share. Here circles are used to encode the data, so you can say it is the perfect example of the Bubble Chart. On rolling the mouse over, you can see the movies they have worked for, whether it has won an Oscar and the connection they have with other actors/directors/producers. 2. NY Times: Mapping the Decline of Stop and Frisk by Police Source: The New York Times Mike Bostock once worked in New York, and this is another example of his work. If you want to check the decline of the incidence of stop and frisk by police in NYC, visit the site we have shared above. On rolling the mouse over, you can spot the incidence of stop in each city. And the use of the colors gives more information about the demographics and the race of the people that were stopped. The information in the page lets you compare the stoppages the cops had to make in the first half of 2012 and the latter half of 2013. 3. Uber : Engineering Intelligence Source: Uber Engineering Blog A company like Uber would have great and multiple uses of data visualization as evidenced by the link we have shared above. Ever since data visualization was used in Uber, there was a sea change in the public-facing information based on visual analytics and mapping feature provided by the company. The company combated all the challenges it had to face during the switch over to visual narratives and was successful in providing better service to its customers. This helps them make informed business decision through data storytelling and played a role in making the traffic in the city safe and efficient. 4. Padma Awards: Complete Details of Winners Source: Padma Awards Padma Awards are civilian honors instituted by the Govt. Of India to recognize the exceptional achievements of persons who have excelled in various fields like sports, art, culture, social work, etc. Visit the Padma Awards website and you will see an incredible lot of information in a single page. All you need to do is click on the relevant field and a library of information opens before you. It gives details of winners of Bharat Ratna, Padma Vibhushan, Padma Bhushan from 1954. The same page also gives you information on internationally acclaimed personalities and in what fields they were awarded for. The information on awards gained from this site bears testimony to what D3.js can do when it is leveraged in the right way. Wrap Up The impact of data visualization in the corporate world is massive, especially since it allows you to change only those attributes that need changing and enabling you to make productive control of data. This allows you to reduce overhead, allow better graphical complexity, even at high frame rates. D3.js is definitely the most popular choice when you look at the other available alternatives. It lets you bring data to life using CSS, HTML and CVG, enables you to make full potential of modern browsers, customize dashboards and data stories for web at low cost, and negates all the big data challenges that you have faced so far. There is a great support group that would help you utilize the full power of D3.js and amazing documentation that you can exploit to the fullest. With D3.js, your creativity is on an all-time high and you can make use of the existing charting libraries and codes to make a link between the data and the graphics, and create some of your own as well. Want to give a visual touch to the various data in your website? Come to us; we will do it for you! [Contact Us Today!](http://<a href="javascript:void(0);" onclick="getQuote();">Contact Us Today!</a>)