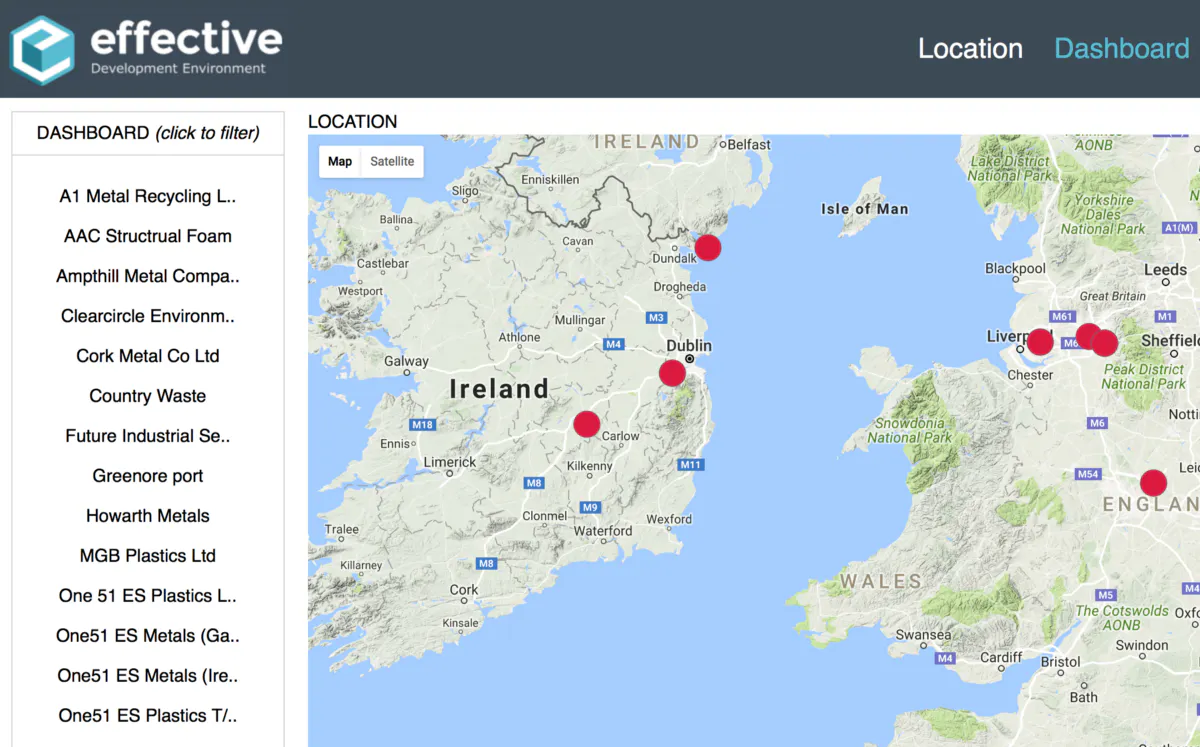
A recent challenge was to link data with longitude and latitude coordinates which I’d used when developing a compliance dashboard. Here’s the . training final visualisation I’d worked with static Maps before but the client wanted to use live maps which responded to the content. Here’s how I did it in 10 easy steps with a huge amount of help from Mike Bostock’s . Google starter code — prepare your data. is a list that contains longitude, latitude and any further variables you might need. You can reset the data and call the code again and the map will redraw within the appropriate boundaries. Step one my_data — declare the bounds. Step two 3. — extend the bound for each row in the data. Step three 4. — select the <div> or <td> where you want to place the map. Step four 5. — create the map and fit the bounds Step 5 6. — declare an Overlay, an onAdd function and the append the layer. Step 6 7. — within the onAdd Function, declare a draw function, set the Projection and then draw each marker appending the data. Step 7 8. — transform (see above) is a function to position each SVG Step 8 9. — now draw the circles. You can add tooltip functionality if you want. Step 9 10. — bind the overlay to the map. Step 10 11. — finally, you need to set the CSS of the individual layers. Step 11 .layer, .layer svg {position: absolute;} .layer svg { width: 60px; height: 60px; padding-right: 100px; font: 10px sans-serif;} You can also set style attributes for .layer circle, either in CSS or in your D3.js code.