1,420 reads
Creating and Deploying a Simple Helm Chart
by Pavan BelagattiSeptember 22nd, 2022


Too Long; Didn't Read
Helm is a popular open-source tool for managing Kubernetes clusters. It simplifies the process of installing, updating, and removing applications by packaging them as “charts” These charts are then installed on your cluster with one command. To get started with Helm, you need to create a chart for your application or find one online that suits your needs. The Helm chart is an archive of all the resource definitions that are needed to deploy an application, including the configuration files and scripts needed for deployment.Companies Mentioned


DevOps has generated so many opportunities for software organizations to improve their operations. Software development best practices have given rise to many platforms and tools that make it easier to deploy software quickly. Kubernetes and Helm can do so much together to help developers deploy software with less effort. Kubernetes is the most popular open-source platform for running container-based apps in the enterprise. In fact, many organizations aim to run all their production deployments on Kubernetes. These are exciting times for those in the Kubernetes community because we’re seeing more and more users leverage its extended capabilities for even deeper operational insight and control. One such capability is the use of Helm to package and deploy individual Kubernetes applications.
What is Helm?

Image credit: IBM Developer
Helm is a popular open-source tool for managing Kubernetes clusters. It simplifies the process of installing, updating, and removing applications on your cluster by packaging them as “charts.” These charts are then installed on your cluster with one command.
Helm relies on the concept of charts. A chart is an archive of all the resource definitions that are needed to deploy an application to Kubernetes, including the configuration files and scripts needed for deployment. To get started with Helm, you need to create a chart for your application or find one online that suits your needs. Below, we will go through a brief tutorial on how to create a simple Helm chart.
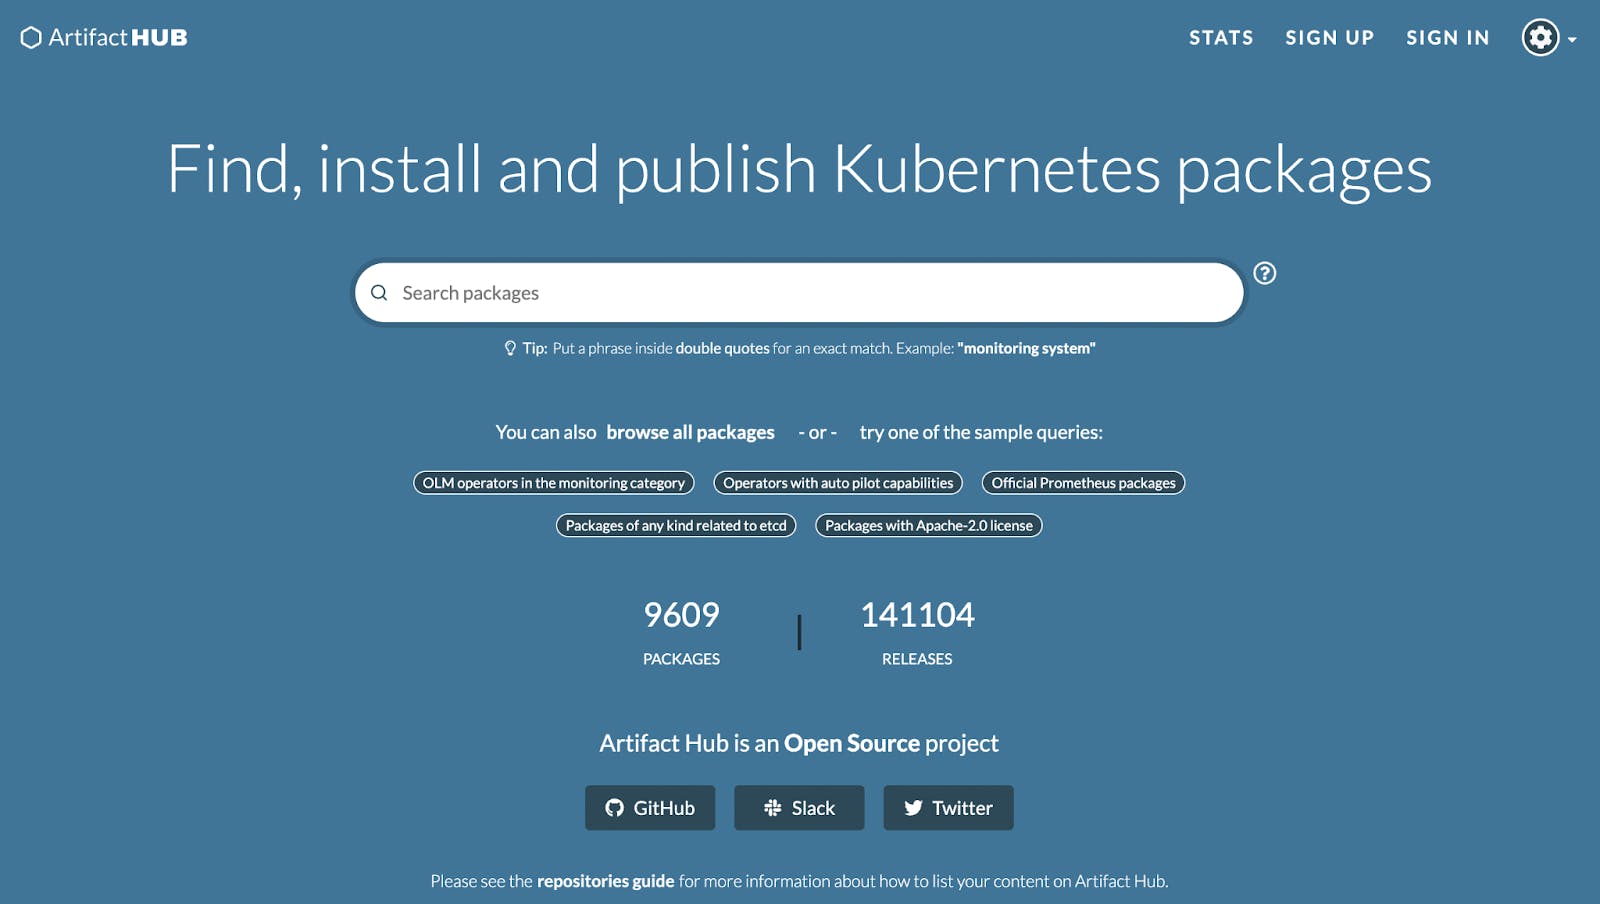
You can quickly install software onto your Kubernetes cluster, and the public Helm charts are readily available in ArtifactHub.

Prerequisites for this tutorial:
- Install Helm from the official Helm website
- Install Rancher Desktop or Docker Desktop (with Kubernetes enabled)
- Sign up for the Harness Software Delivery Platform to deploy to any Kubernetes environment
Tutorial: Create a Simple Helm Chart
Use your terminal to create a new directory to store our code:mkdir helm-exampl ecd helm-example
Create a new chart and give it an appropriate name:helm create new-chart This creates a simple chart that will deploy an Nginx pod.
You should see the following output on your terminal: Creating new-chart
Change the directory into the folder of the new chart that we just created:cd new-chart
With ls command, you can see the contents of the new chart folder:
Chart.yaml charts templates values.yaml
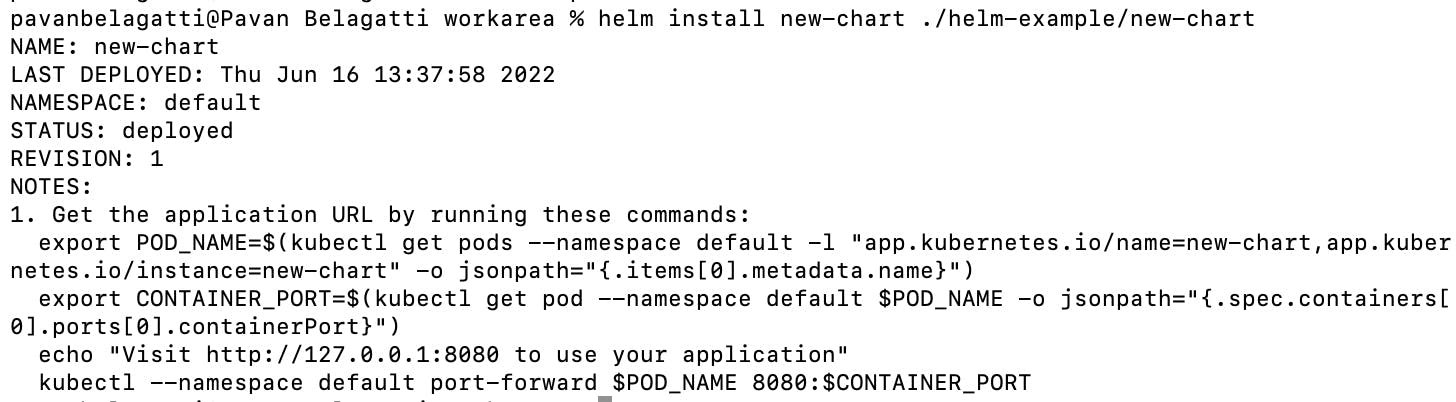
Keeping everything as it is, we will deploy our first chart:helm install new-chart ./helm-example/new-chart
Note: Use this command outside of your directory to set the path correctly as shown.

With the command helm ls, you can see your deployed helm chart:


You can also confirm that the pods are up and running with the command kubectl get pods:


In this example, we are using Rancher Desktop so it is easy to access the deployed chart. You can download Rancher Desktop from the official website.
And when I check my localhost:56253, I can see the Nginx container running.
As stated previously, if you are using Rancher Desktop, it’s very easy to access your newly deployed app.


Next, you can package this chart to share it with anyone with the command: helm package ./new-chart


Deploying with Harness CD
It is very easy to use Helm charts and do deployments with Harness CD. Further in this tutorial, you’ll see how to deploy a publicly available Docker image to your Kubernetes cluster using Helm charts and a rolling deployment strategy through Harness CD.
Assuming you have a Kubernetes cluster set up with 3 nodes, 4vCPU machine type, 16GB memory, and 100GB disk.
Head to Harness and sign up if this is your first time using the Harness platform. Once you log in, switch to the NextGen mode, which is the newest, most advanced version.
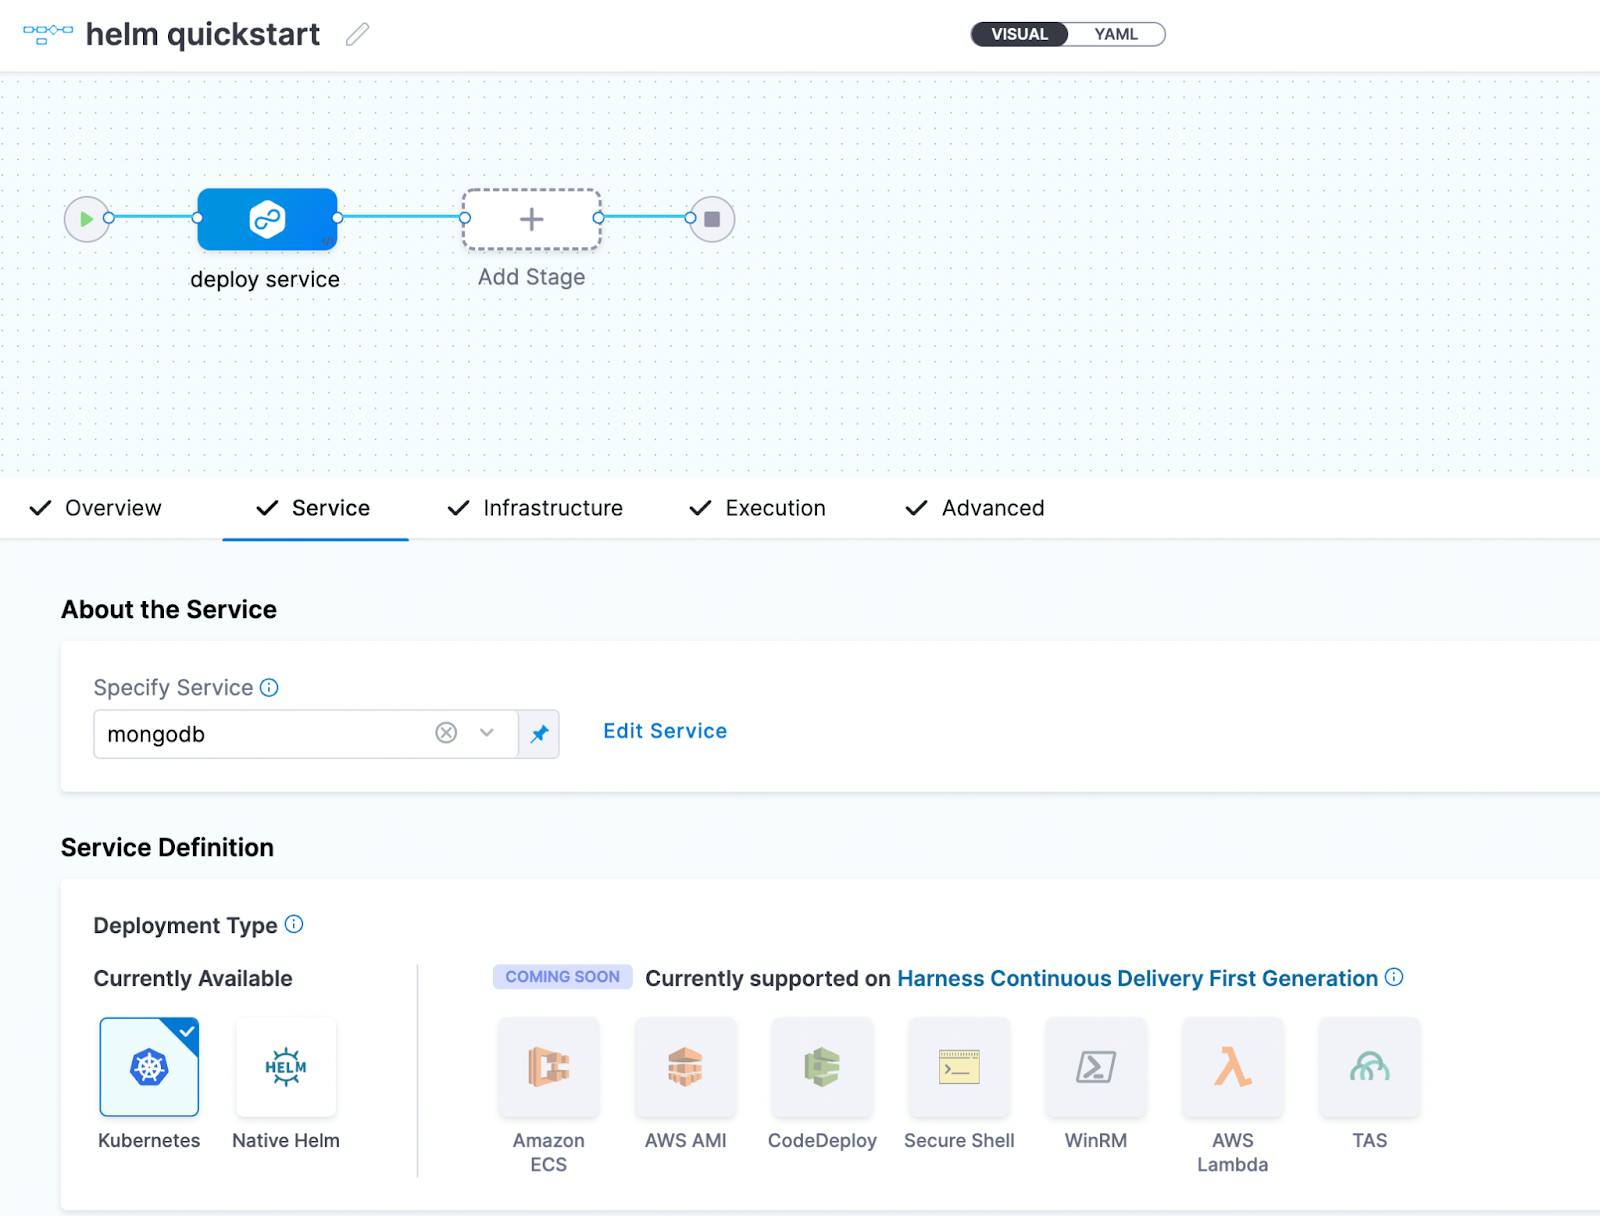
Create a project with any name you want, select continuous delivery and start creating the pipeline to deploy a MongoDB chart.


Every stage is self-explanatory: Add the required fields. Then specify the service, select deployment type as Kubernetes, add the manifest details as Helm chart, and then create a new HTTP Helm repo connector.

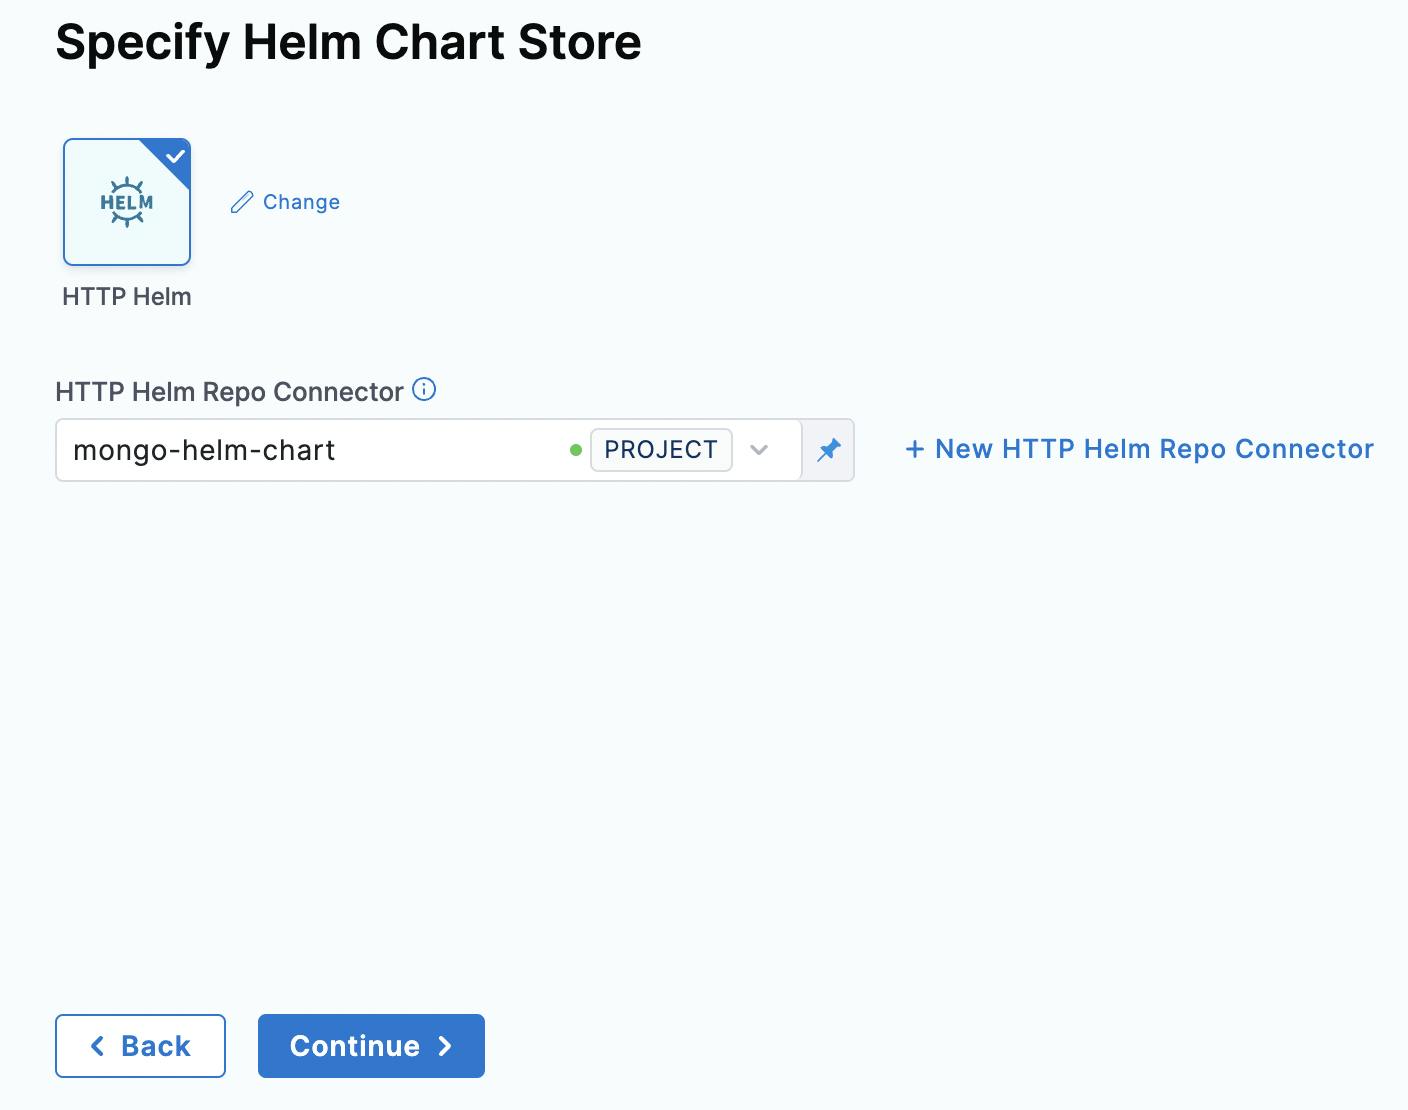
Note that I have already created the HTTP Helm Repo Connector in this example. You have to create a new one if you are new to this process.
Once you click on + HTTP Helm Repo Connector, it will ask for a few details and you need to provide them. Provide Helm Repository URL as https://charts.bitnami.com/bitnami as we are using the official chart.


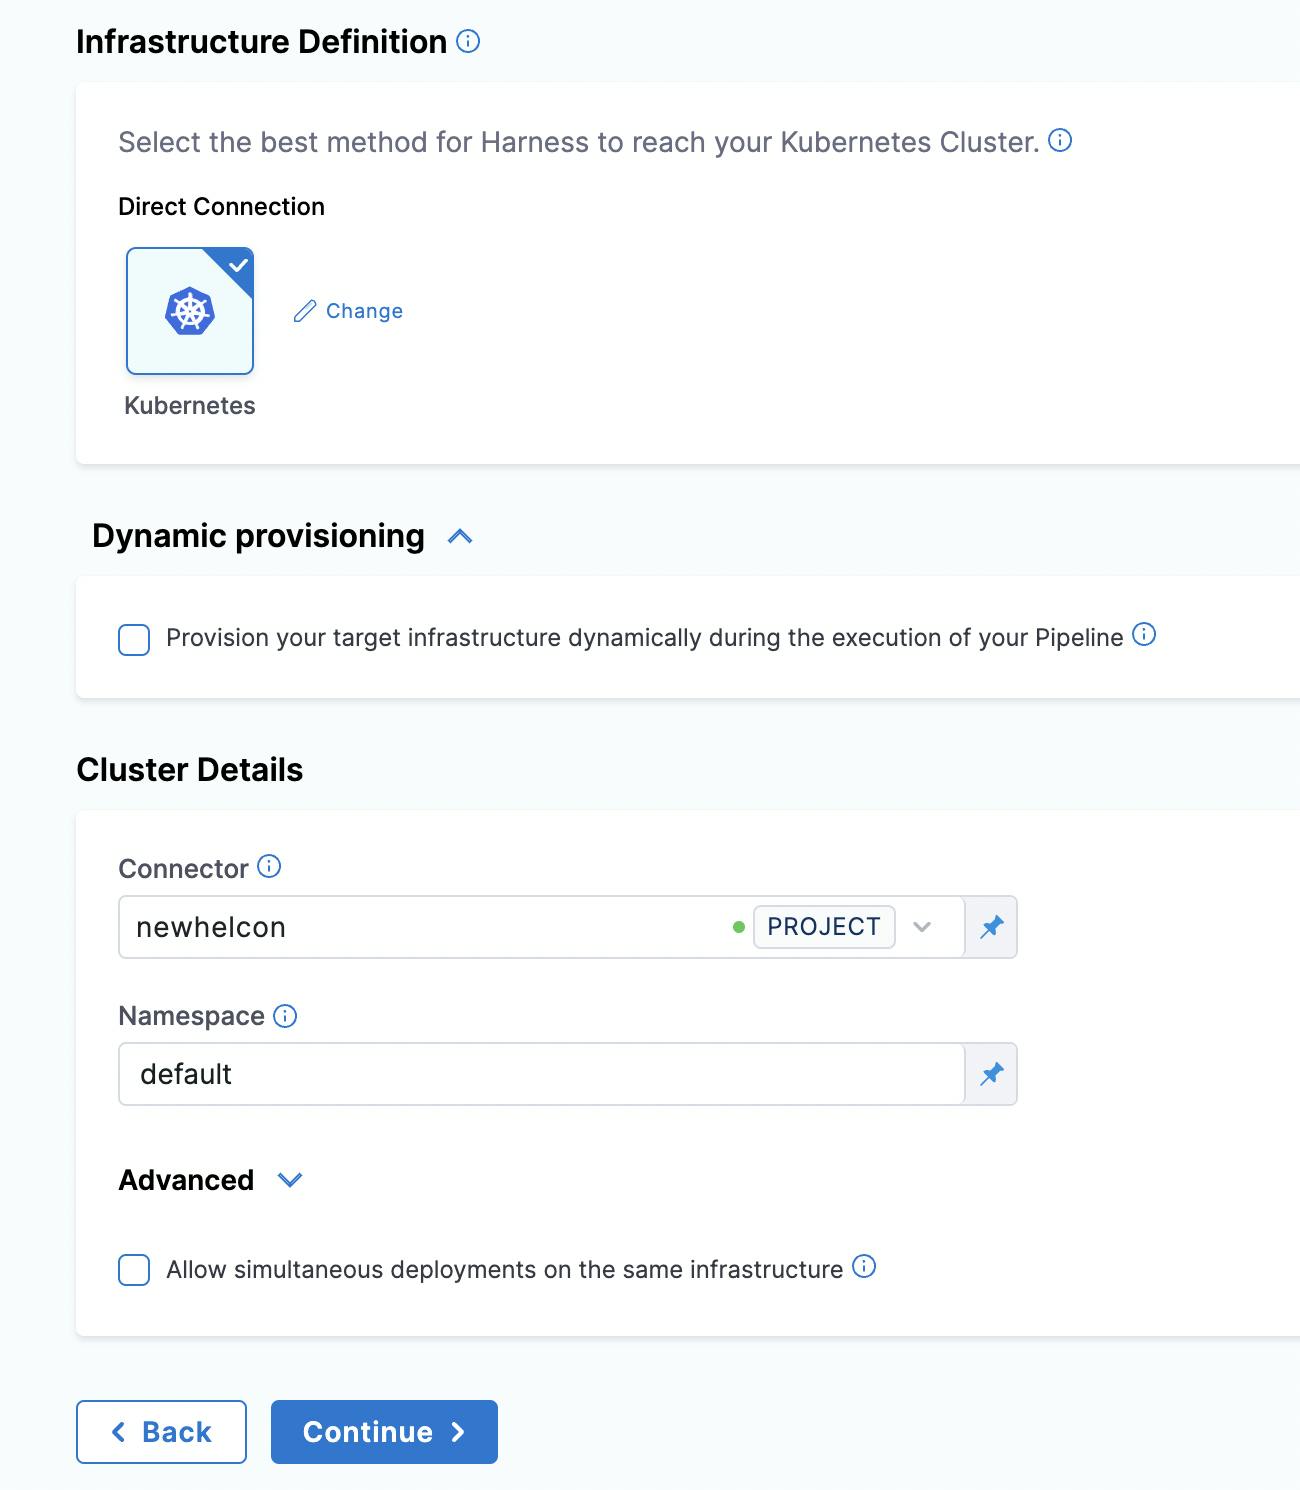
In the infrastructure setup, give cluster details:

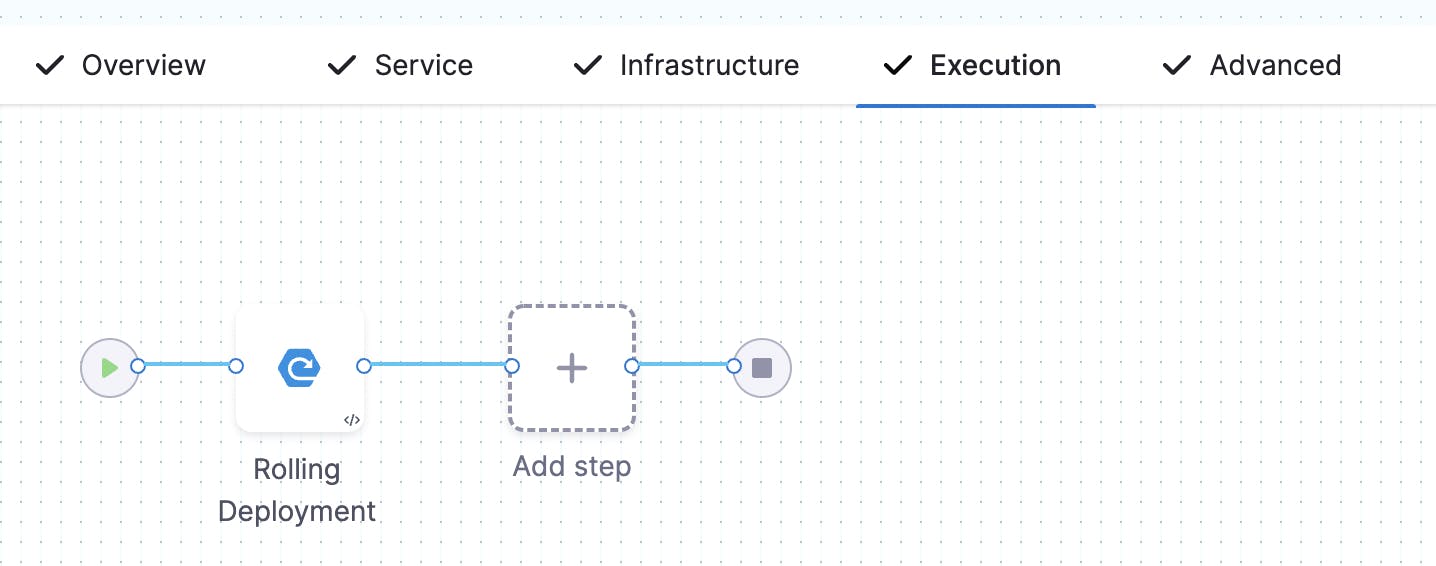
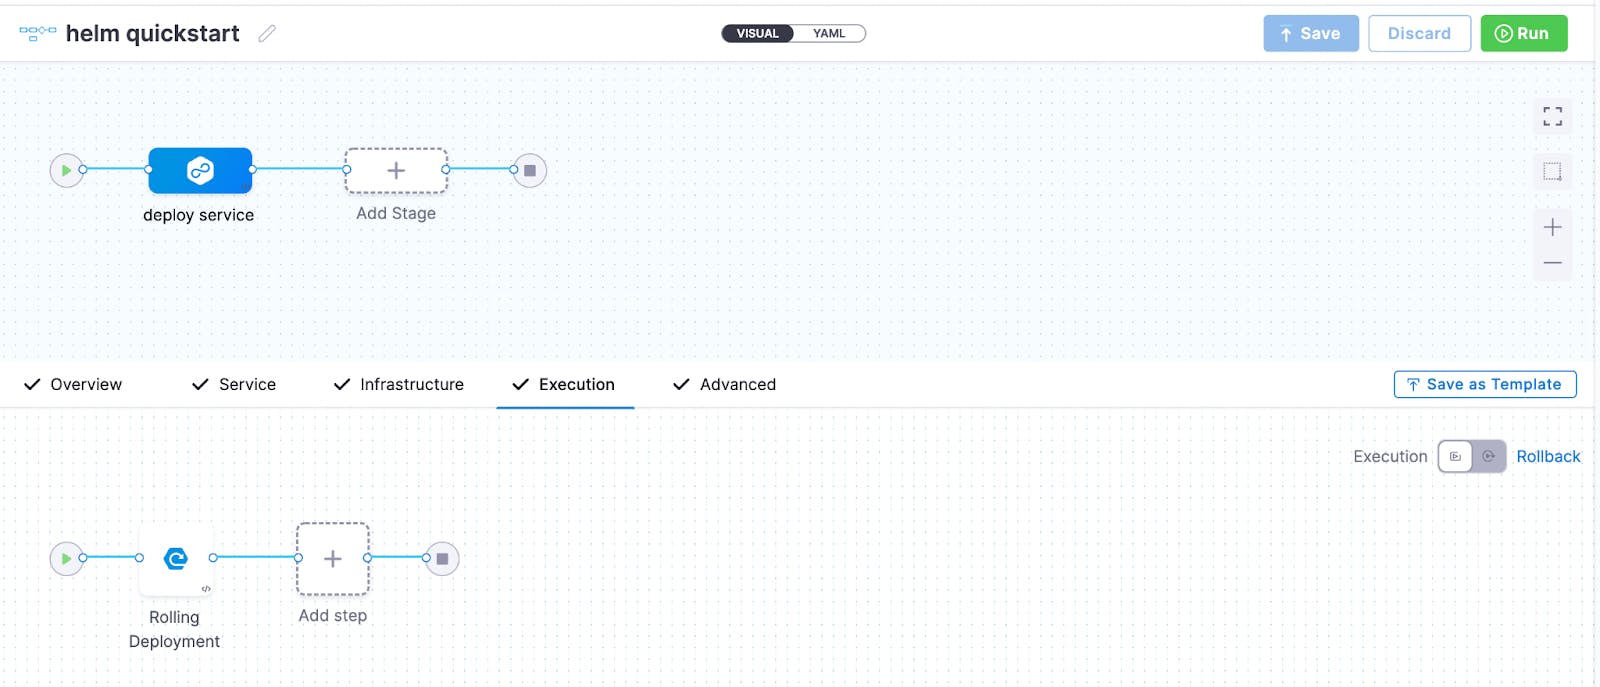
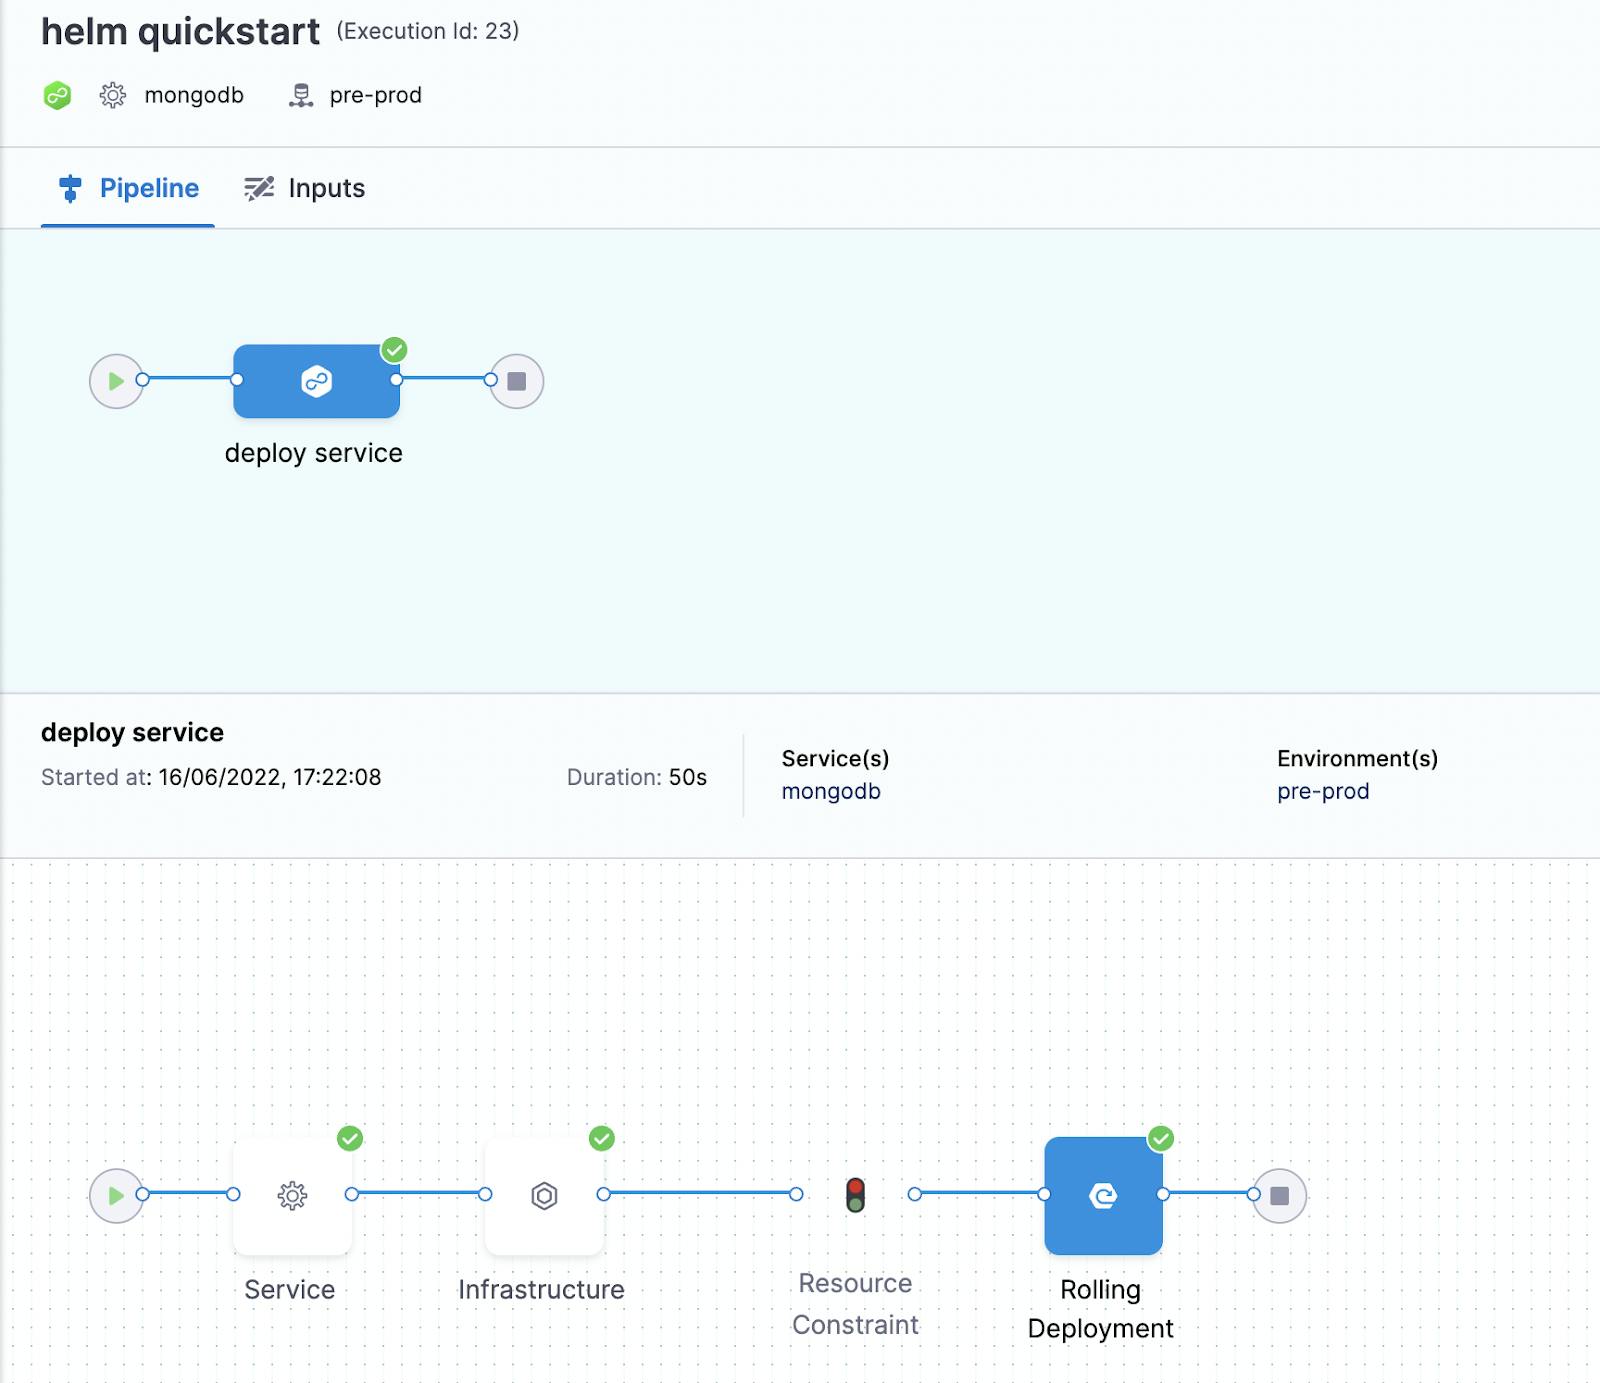
In the execution step, select the Rolling deployment strategy:

Once everything is set up, save the pipeline and run it.


You should see a successful deployment of the MongoDB image.


Confirm the deployment by going to your cluster setup. I have my cluster created on GCP and I can confirm that the MongoDB image has been successfully deployed through the Helm chart.

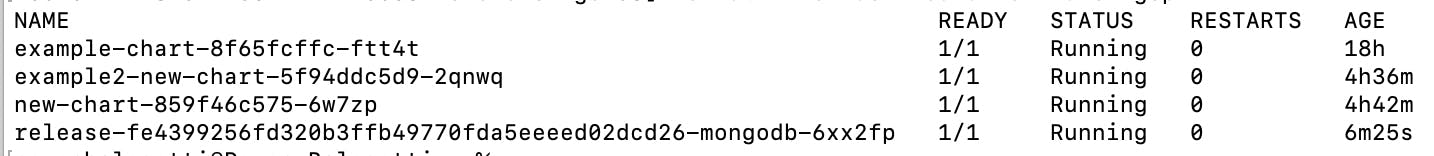
Congratulations! You have successfully learned how to create a Helm chart and deploy it with the help of Harness.
Also published here.

L O A D I N G
. . . comments & more!
. . . comments & more!