When a pseudonymous programmer introduced “a new electronic cash system that’s fully peer-to-peer, with no trusted third party” to an online mailing list in 2008, very few paid attention. Ten years later, and against all odds, this upstart autonomous decentralized software offers an globally-accessible alternative to modern central banks.
While Bitcoin is a new invention of the digital age, the problem it aims to solve is as old as human society itself: transferring value across time and space. Ammous shows that it is no coincidence that the loftiest achievements of humanity have come in societies enjoying the benefits of sound monetary regimes, nor is it coincidental that monetary collapse has usually accompanied civilizational collapse.
Bitcoin is a decentralized, distributed piece of software that converts electricity and processing power into indisputably accurate records. This remains true for the bitcoin blockchain, although hackers have been able to steal private keys.
Thus Bitcoin is allowing its users to utilize the Internet to perform the traditional functions of money without having to rely on, or trust, any authorities in the physical world as long as they keep their private keys safe.
Bitcoin also has an automated and perfectly predictable monetary policy, and the ability to perform final settlement of large sums across the world in a matter of minutes.
In this article, we will analyse the different functions of a sovereign currency and review if Bitcoin is showing signs of implementation.
The store of value is one of the three functions of the major sovereign currencies (the other two are medium of exchange and unit of account). “Store of value” refers to the function of a currency to keep or increase its purchasing power over time.
In general to become a store of value, inflation has to be very limited
Bitcoin inflation is defined to decrease over time to zero. The graph below shows the Bitcoin price versus the total supply of Bitcoin. The supply of Bitcoin is continuously decreasing over time and the Bitcoin supply is inflating with about 3.8% per year at the moment.
With the next halving of the block reward time (probably in 2020), Bitcoin will inflate with less than 2% per year (or a stock-to-flow ratio above 50).
(Figure: Bitcoin price and supply over time)
One way to measure the store of value is in terms of cumulative mining rewards, which is driven by the inflation of Bitcoin (see here). The inflation can also be put in relation to the supply of the tokens, which is called the stock-to-flow ratio (see here or “The Bitcoin Standard” by Saifedean Ammous). The stock-to-flow ratio is the amount of the asset that is available divided by the amount produced every year:
SF ratio = token supply /dilution rate per year = 1 / inflation rate per year
The graph below shows the different stock-to-flow ratios versus the Bitcoin Price. The stock-to-flow ratio has moved from about 2 during the period 2008–2012, to about 8 during the period 2012–2016, to about 25 since 2016 and probably until 2020, when the next halving to a stock-to-flow ratio of about 60 occurs.
Central banks are targeting a 2% inflation rate, so a stock-to-flow ratio of about 50 for comparison. So with the next halving, Bitcoin will achieve this metric. The difference is of course, that the next steps are pre-programmed and the stock-to-flow ratio will go to infinity.
(Figure: Bitcoin price versus stock-to-flow ratio.)
Of course we have not seen many changes in the stock to flow ratio, but so far the changes were associated with a step change in the bitcoin price. Assuming that this pattern continues, the chart can be fitted with a regression line of
Bitcoin price = 0.209 * stock_to_flow_ratio^3.08
For now, this regression implies increasing Bitcoin prices with time. The argument is that the mining process generates Bitcoin and these have to be sold on the market continuously to pay for electricity. After the next halving, the pressure on the market to absorb these bitcoins will be just 50% and could therefore provide a relief on the Bitcoin price.
PlanB published a chart over time here to show a potential development of the bitcoin price using the stock-to-flow ratio.
Overall, although Bitcoin is still deviating from the predictions of these models, it seems to be trending towards a store of value.
Another important value of Bitcoin is as a medium of exchange. Especially Bitcoin are necessary to pay Bitcoin transactions. At the moment transactions have to be paid with a very small amount of bitcoin, because the transactions are mostly covered by the inflation of Bitcoin.
This inflation pays the miners a block reward for participating in the transaction. The miners have to use of energy to run the mining machines and win a block to receive the block reward.
The amount of reward is driven by the global hashrate. Essentially the hash power of a single miner is divided by the global hashrate and that defines the generated bitcoin over time. The mechanism that guarantees the adoption to changes in the global hashrate is the global block difficulty. Difficulty is a measure of how difficult it is to find a hash below a given target and valid blocks must have a hash below this target.
The global block difficulty increases with increasing an increasing number of machines and therefore an increasing global hash rate and vice versa.
The global block difficulty therefore guarantees that the number of produced bitcoins are in line with the inflation rate that is pre-defined (see above).
The graph below shows the continuous increase in global block difficulty and therefore global hashrate versus the bitcoin price. The continuous increase in difficulty is due to better hardware and also an increasing number of machines that participate in the mining process. If this trend continues, it will become very expensive to produce bitcoins and therefore miners will probably expect an increasing bitcoin price to be compensated for that.
However, the bitcoin price is meandering largely around the difficulty level and the difficulty level also decreased multiple times.
In general, it seems like the bitcoin price is driving the difficulty though and not the other way around. Miners are incentivized to plug in more machines if the bitcoin price is high and are disincentivized if the bitcoin price is low. Of course, since there is a manual process involved the difficulty changes with a time lag.
For example in 2018 while the Bitcoin price collapsed, the difficulty continued to increase. Since the bitcoin price and the difficulty are highly correlated, we will probably see hedging products to take out the risk of difficulty changes.
(Figure: Bitcoin price and global block difficulty over time.)
Another intrinsic value of Bitcoin can be derived from transaction volume on Bitcoin and was summarized under the NVT ratio here. The NVT ratio is defined as
NVT ratio= Network value/Transaction volume
=(token price * token supply)/(token price * transacted token)
= token supply/transacted token
= 1/token velocity
The logic is that the more transaction volume in USD terms, the more value Bitcoin has. The argument is similar to SaaS companies like Amazon, which rarely have profits, but are valued on turn-over which drives revenue on their platform.
The graph below shows that the transaction volume ratio tracks the Bitcoin price nicely, but also because the Bitcoin Price is such a big driver of the transaction volume.
The limitation of the NVT ratio lies in the assumption that the fundamental value of cryptocurrency derives only from its function as a medium of exchange that is represented by token velocity.
The usage of cryptocurrencies as a store of value is overlooked in the model as well as that some superusers might drive the value of the network (similar to social platforms).
To illustrate the point: an increase of the NVT ratio due to a reduction of the transaction volume does not necessarily imply an overvaluation of the token.
It could also be the result of an increasing number of long-term hodlers hoarding more tokens, thus causing a decline in transaction volume (see https://medium.com/coinmonks/cryptocurrency-valuation-d9979074404).
Also, the NVT ratio failed to explain the 2017 crypto bull market when the NVT ratio was below its normal range, thus indicating undervaluation.
The NVT ratio also failed to identify the 2018 crypto bear market when there was clearly a market collapse while the NVT ratio remained in its normal range.
Overall, probably the strongest feature of Bitcoin is the ability to transact. We conclude that Bitcoin can be considered as a medium of exchange.
The store of value and the medium of exchange can be combined in one metric and tested against the bitcoin price
Yulin Liu proposed to measure the value of Bitcoin with a combination of token velocity (just transactions, not including the price), staking ratio (percentage of tokens used for holding) and dilution rate:
Token utility = token velocity * staking ratio/dilution rate
The graph shows the token utility for 1 day staking ratio over time versus the Bitcoin price.
The staking ratio and the dilution rate can be considered as indicators for the store of value, while the token velocity as an indicator for the medium of exchange. Yulin Liu argues that the PU ratio (Price over token utility) detected the two big Bitcoin bubble periods at the end of 2013 and 2017, where the P/U ratios were way out of its normal range between 50 and 200.
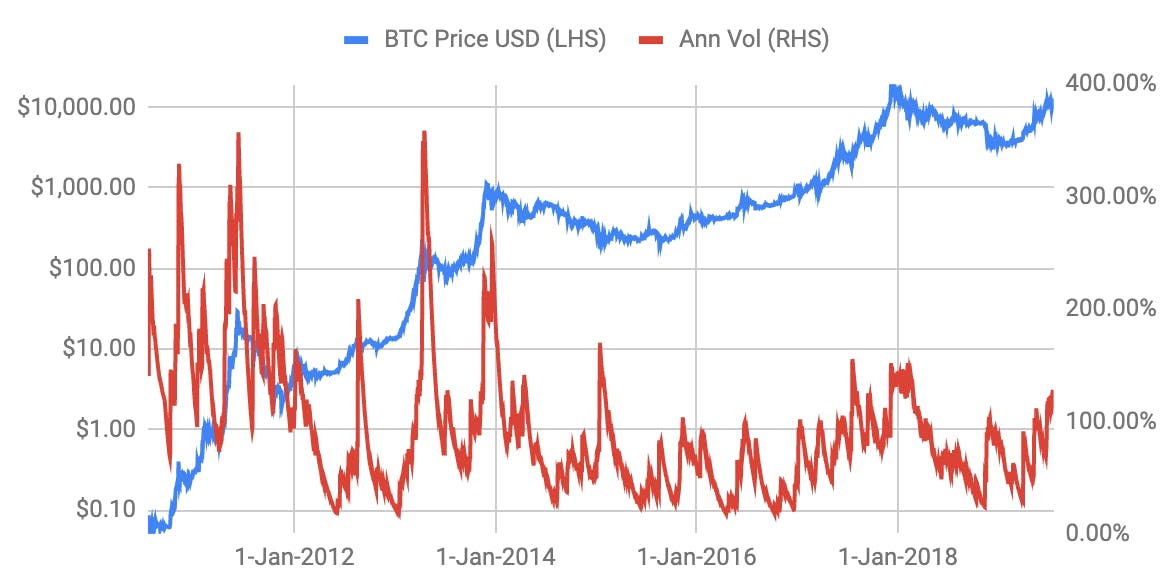
But before we conclude our analysis, we will consider the final function to act as a sovereign currency. This function is the unit of account and therefore the comparability of prices. Bitcoin and other cryptocurrencies have generally a very large annualised volatility of more than 100%.
For reference, we are calculating the volatility using an EWMA model on a daily basis here. In general, to be a unit of account, the volatility has to decrease dramatically.
In fact, the volatility of Bitcoin already decreased from levels above 300% down to 100% levels at the moment. By 2021, the volatility should be decreasing down to less than 20%, which would make it comparable to fiat currencies that have volatilities of about 8%, but do have regular spikes in volatility up to 20%.
The driver behind decreasing volatility could be a better understanding of the valuation models and more liquidity in the market. The liquidity in the market has increased from 10m per day in 2014 to more than 10b per day today (see https://coinmarketcap.com).
We conclude here that Bitcoin cannot serve as a unit of account simply because the volatility is too high. We do agree that the volatility is decreasing, but it seems like a long way to go.
Bitcoin might provide a globally-accessible alternative to modern central banks. The functions of major sovereign currencies are store of value, medium of exchange and unit of account.
Bitcoin provides a pre-programmed inflation and a borderless means of transferring value, but also a very high volatility in the price versus other sovereign fiat currencies.
In summary, we are suggesting that the Bitcoin price should depend on the token velocity (medium of exchange), staking ratio (store of value) and the dilution rate (store of value) as well as the volatility of the Bitcoin price to achieve unit of account such as
fair value = token velocity*staking ratio*volatility/dilution rate
This ratio incorporates all three measures of sovereign currencies that Bitcoin will have to hold up to in order to become established.
At the current moment, Bitcoin does not achieve this goal, but seems to be trending in that direction.