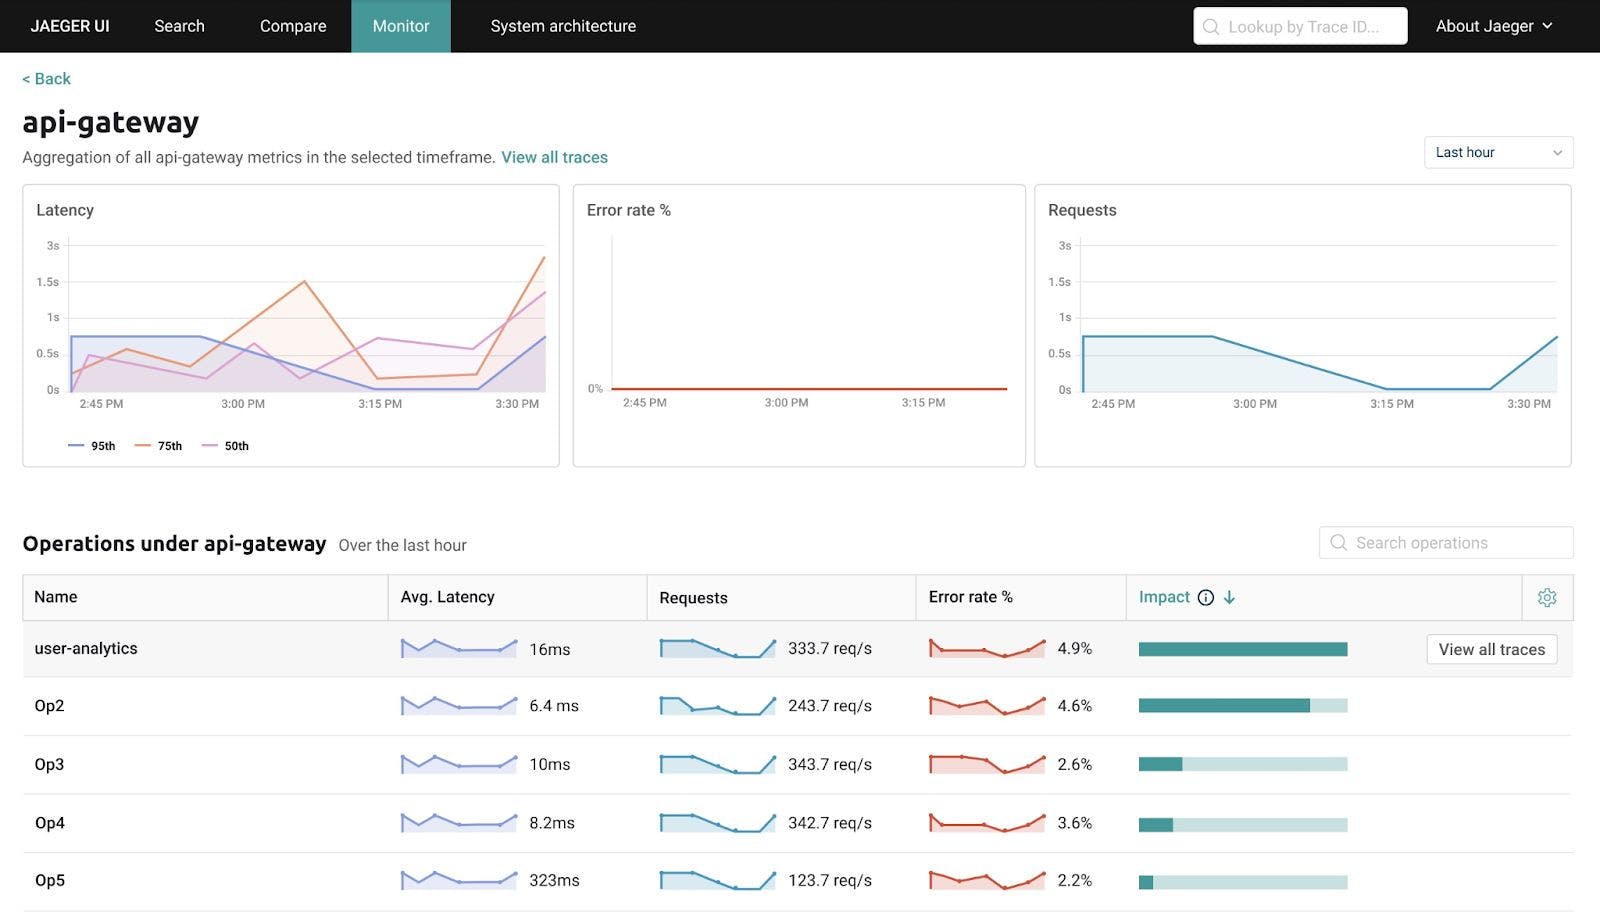
credits: jaegertracing.io Let’s say your services get thousands of requests per second, you log enormously and you don’t miss any exception in your logging system. Suddenly, the operation team sent you a message pointing to an error for a customer with id on production and you couldn’t understand why all the people around you are over-stressed… and then the penny dropped. The customer is actually a friend of the boss! ( X X true story) Ok… Let’s see what you can do: You searched on your logging system and waited forever as there are TBs of logs. Then you tried it again with a more detailed query such as , and got the resu… oh, another problem! Your teammate said that you need to replace with After you also fixed that and waited about 10 secs, 24 results appeared on the screen! Now you are ready to analyze them. X userId=X not in this and that but in this at time t Error: wrong query syntax. not in this in not this. … 10 minutes later… You figured out that called service and as method in took 3 seconds, service returned 500. ServiceA ServiceB LongRunningProcess ServiceB A After all, you are glad to find the bug in about 20 minutes. Let’s replay the process assuming that you use and . Open Tracing Jaeger You visited Jaeger UI on your browser You wrote to tags and set the date userId=X You clicked search and the result is below: Example request that Jaeger traced In couple of seconds, you can understand that took actually 3 seconds, and as a result, returned LongRunningProcess ServiceA 500. Open tracing is an open standard for distributed tracing, and Jaeger is the tool that implements the standard. Please check the Jaeger architecture from beforehand. it’s official documentation Today, we are gonna create 2 APIs and 1 console client for our demo environment using .net core. I will also use a simple wrapper that I wrote as it brings simplicity in my opinion. Let’s start! Clone the Repo & Prepare your environment If you have and installed on your workspace, you are ready to go. .net core docker Get the docker image for and run it: Jaeger docker run -d --name jaeger \ -e COLLECTOR_ZIPKIN_HTTP_PORT=9411 \ -p 5775:5775/udp \ -p 6831:6831/udp \ -p 6832:6832/udp \ -p 5778:5778 \ -p 16686:16686 \ -p 14268:14268 \ -p 9411:9411 \ jaegertracing/all-in-one:1.6 Clone the repo I prepared for this article: https://github.com/skynyrd/opentracing-with-jaeger We have one .net core solution containing 4 projects: , , and We are going to walk thru all of them. Let’s start with to understand the dynamics of the Jaeger client. ConsoleClient ServiceA ServiceB JaegerWrapper. JaegerWrapper JaegerWrapper: For syntactic sugar — Because why not? In order to use Jaeger client, we first need to understand how traces work in our code. A is a data/execution path through the system, and can be thought of as a directed acyclic graph of . trace spans A represents a logical unit of work in Jaeger that has an operation name, the start time of the operation, and the duration. Spans may be nested and ordered to model causal relationships. span — Official Jaeger docs. In an application, we need to have a Tracer that manages our spans. I strongly recommend having one tracer in a microservice for simplicity. After creating the and registering it, the jaeger client library starts to analyze the controllers in the system by default, even we don’t need to create a single and for that, all created by the library. However, if we want to analyze a specific method, or add some additional tag/log to our spans, we need to create a and bind a to it. Tracer Trace Span OpenTracing.Contrib.NetCore Trace Span Important Note: If you create and activate a span when there is another active span in the system, it becomes a child. You can see it in the diagram above; parent spans are expandable. I wrote a simple builder for this purpose and is a class library that contains it, you can use/copy if you like. JaegerWrapper _traceBuilder.WithSpanName("LongRunningProcess").WithTag(new StringTag("exampleTag"), "exampleValue").TraceIt(() =>{Thread.Sleep(3000);}); To give an example, this code block is for span represented by a yellow horizontal bar in the diagram above. We added to it and we can even add more complex structures using method. Time consumed by is published as a span duration in the GUI. In the example, I used a simple , but you can also return something ( instead of ) e.g.: LongRunningProcess exampleTag: exampleValue WithLog TraceIt Thread.Sleep(3000) Func Action var result = _traceBuilder....TraceIt(() =>{return "something"} Passing across the APIs If you are going to HTTP call a service and you want to preserve your span lifetimes, you need to notify the other service somehow. For the most cases you would like to use the package to automate the configurations, but if you are curious, here is the logic behind that: OpenTracing.Contrib.NetCore Jaeger solves it with HTTP headers that are going to append to the request. You can also use for more abstraction: JaegerWrapper Configuration for WebAPIs For and we need to register the services for Jaeger: ServiceA ServiceB // In ConfigureServices method of Startup class: GlobalTracer.Register(Tracer);services.AddOpenTracing(); If you also want to use the wrapper, you can simply add these: serviceProvider = services.BuildServiceProvider(); var services.AddScoped<ITraceBuilder>(t => TraceBuilder(serviceProvider.GetService<ITracer>())); new Example Calls Have a look at of , we call there but didn’t use any JaegerClient or JaegerWrapper method. This is because we added library and it traces our requests in the black box, magically. AWorldController ServiceA ServiceB OpenTracing.Contrib.NetCore Task< > GetBObject( id) httpClient = HttpClient{BaseAddress = Uri("http://localhost:7334")}; private static async dynamic string {var new new **var** result = **await** httpClient.GetAsync($"/bworld/id/{id}"); **if** (result.IsSuccessStatusCode) { **return await** result.Content.ReadAsAsync<**dynamic**\>(); } **throw new** Exception("uncovered area."); } And check the Main method of the ConsoleClient. This time, as this is not a WebAPI, we manually traced our call using JaegerWrapper. traceBuilder.WithSpanName("MainWork").WithHttpCall(client, url, HttpMethod.Get).TraceIt(() =>{ response = client.GetAsync(url).Result; var **if** (!response.IsSuccessStatusCode) **throw new** Exception("uncovered area for the demo."); **var** responseBody = response.Content.ReadAsStringAsync().Result; Console.WriteLine(responseBody); }); I used instead of on production couple of years ago, thus I don’t want to write anything about the performance. But I can say that Zipkin was quite performant. If you have production experience with Jaeger, please comment below, I’m curious about it! Zipkin Jaeger Thanks for reading.