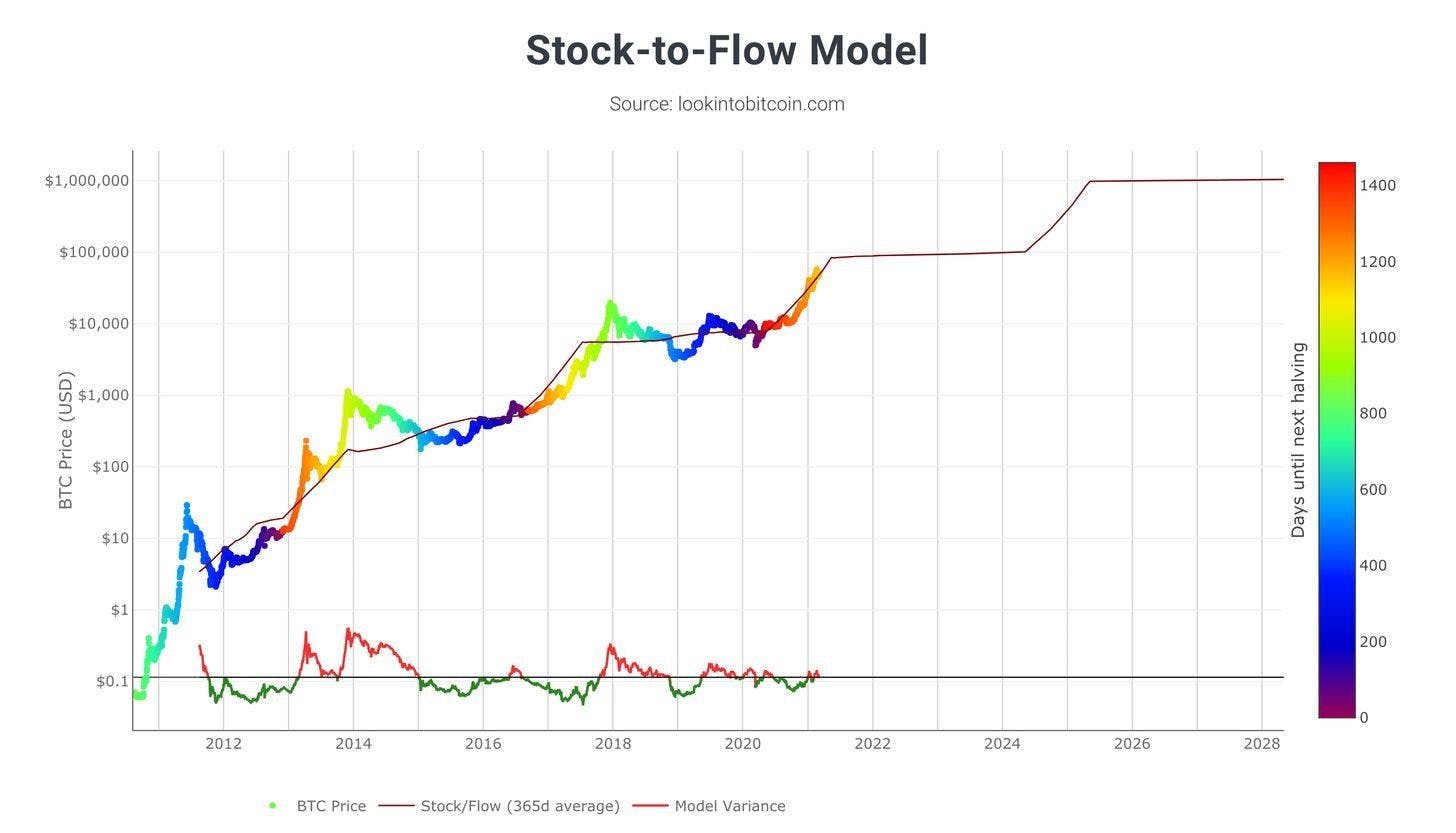
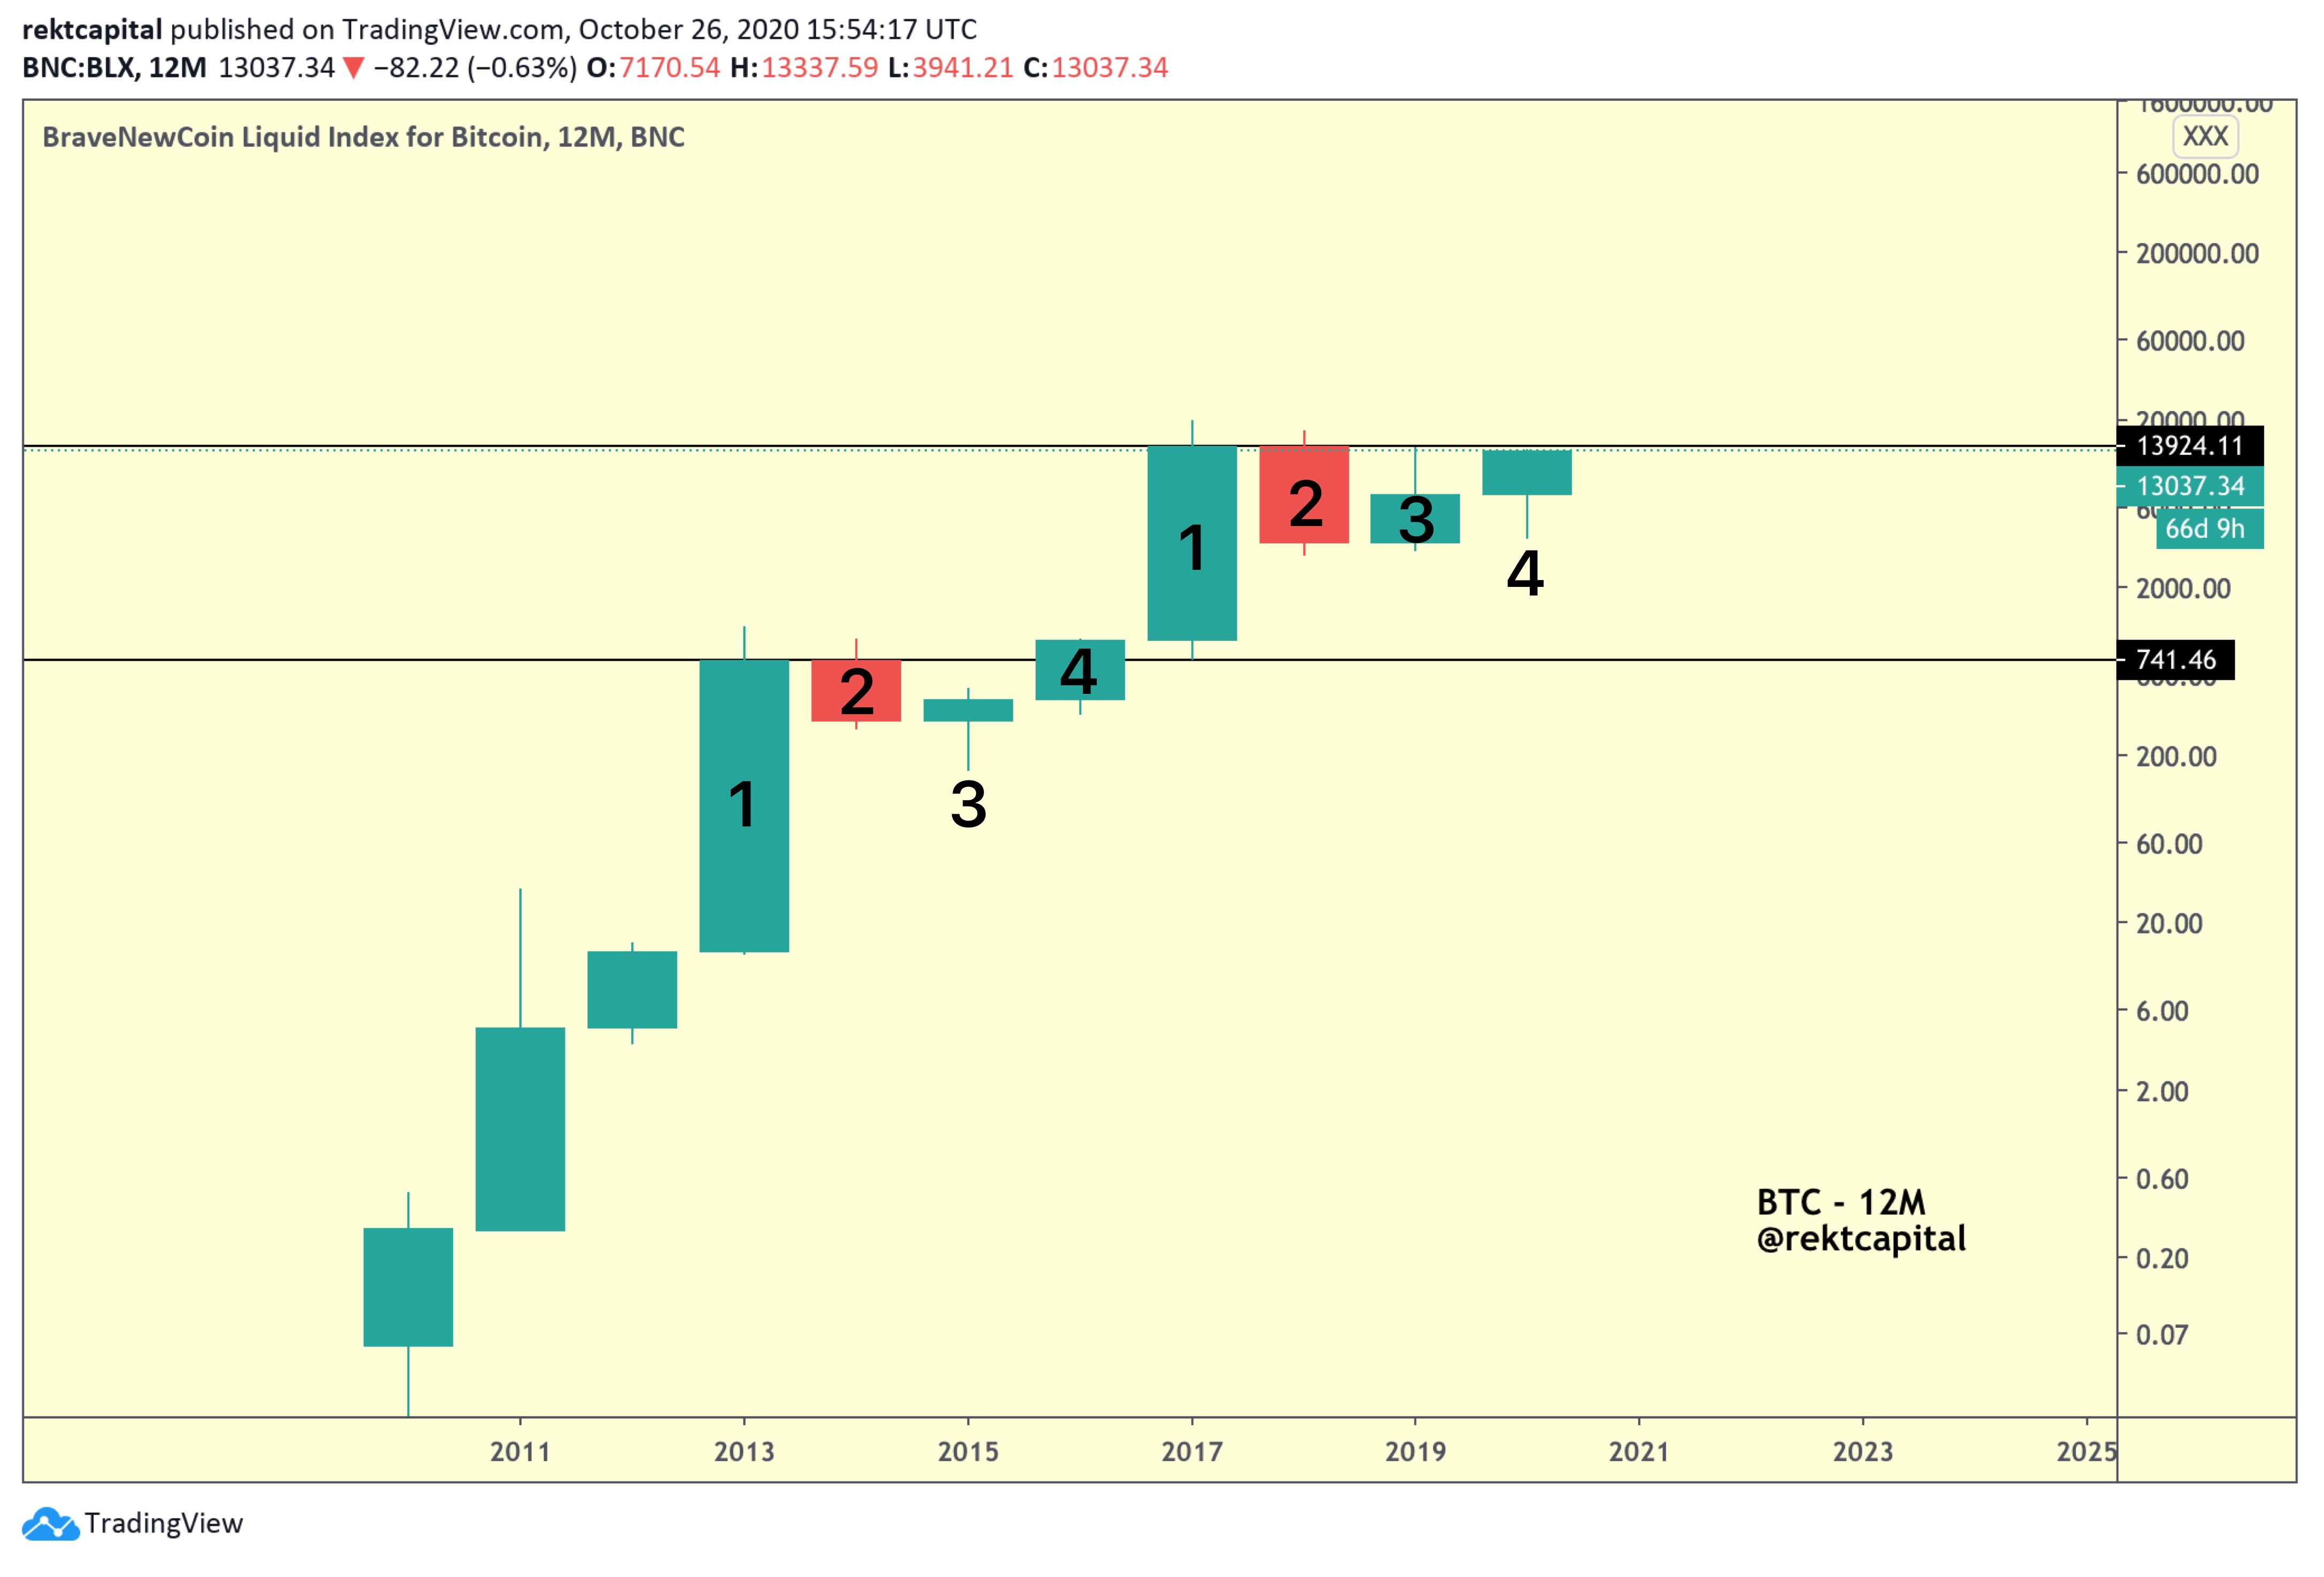
Measuring The Bitcoin Peak Using Data Science Part 2 Preface The created by quantifies the scarcity of Bitcoin and has been a reliable long-standing predictor of Bitcoin’s price trajectory. Stock to Flow model Plan B After all - Bitcoin’s price action has been following the Stock to Flow model, sometimes even exactly tracing it for extended periods of time. This is why the Stock to Flow figures as a useful data science model for investors to fall back on during periods of volatility and uncertainty in the cryptocurrency market. But the usefulness of the model doesn’t end there. Bitcoin’s price also tends to consistently beyond and below the Stock to Flow line. deviate Historically, - whether to the upside or to the downside - in Bitcoin’s price. Bitcoin’s price deviations from the Stock to Flow line have preceded Bear Market bottoms and Bull Market tops In , we examined the first three upside deviations in Bitcoin’s price beyond the Stock to Flow model: Part 1 of the Stock to Flow series 1. The first upside deviation beyond the Stock to Flow line resulted in a Bitcoin price increase. +1157% 2. The second upside deviation beyond the Stock to Flow line resulted in a price increase. +477% 3. And the third upside deviation culminated in a increase in Bitcoin’s price. +554% This is Part 2 of the Stock to Flow series where we will focus specifically on the remaining three Bitcoin upside price deviations from the Stock to Flow line (i.e. 4, 5, and 6). Part 3 will exclusively address the upside deviation from the Stock to Flow line in much more detail in an effort to deduce and the upcoming Bitcoin price peak may take place. sixth when where 4. Fourth Stock to Flow Upside Deviation Bitcoin Bull Market Peak (December 2017) Let’s focus on the instance where Bitcoin’s price deviated towards the upside, beyond the Stock-to-Flow line. fourth This upside deviation from the Stock To Flow line in occurred during the mid-December 2017 Bitcoin Bull Market peak. The deviation began by breaking past the Stock to Flow line in mid-October 2017, when Bitcoin’s price was at approximately $5,500: After breaking the Stock to Flow line, Bitcoin’s price rallied exponentially to a peak of $19,640 in mid-December 2017: Over the span of only two months, Bitcoin’s price deviated the Stock to Flow line: +257% beyond 5. Fifth Stock to Flow Upside Deviation Bitcoin Peak (June 2019) Here’s the time that Bitcoin’s price deviated to the upside, beyond the Stock-to-Flow line. fifth This upside deviation from the Stock To Flow line peaked in June 2019. The deviation began by breaking past the Stock to Flow line in mid-May 2019, when Bitcoin’s price was at approximately $7,300: Just over one month later, Bitcoin peaked at ~$12,900 ($13,900 according to most exchanges): At this point, Bitcoin’s price deviated the Stock to Flow line (or +90% to reach $13,900): +76% beyond Across all upside deviations in Bitcoin’s price beyond the Stock to Flow line, this one in particular was the weakest. But in order to understand this upside deviation, we have to revert to the first principles of the Stock to Flow model and what the model represents. To reiterate, the Stock to Flow model quantifies the scarcity of Bitcoin. And the Bitcoin Halving event promotes this scarcity. And since scarcity enhances value - . Bitcoin’s price appreciates significantly in the several months after the Halving But what we need to emphasise when considering this particular upside deviation in Bitcoin’s price beyond the Stock to Flow model is that it . occurred almost a year prior to Bitcoin Halving #3 Nothing had fundamentally changed in Bitcoin’s protocol at that point and therefore - neither did Bitcoin’s Stock to Flow. After all - whenever a Halving event occurs, the amount of Bitcoin that gets created every 10 minutes is suddenly cut in half, directly impacting the scarcity of the asset. This scarcity is visualised by the Stock to Flow model. So while Bitcoin’s exponential growth to ~$20,000 in December 2017 was propelled by the major fundamental catalyst that was Bitcoin Halving #2… This June 2019 upside price deviation beyond the Stock to Flow line - which occurred a year before Bitcoin Halving #3 - was actually not caused by an increasing scarcity in Bitcoin. In other words, at that point. nothing had changed in Bitcoin’s Stock to Flow In fact, Bitcoin’s Pre-Halving #3 uptrend from ~$3,150 to $13,900 was historically . normal pre-Halving price behaviour After all, Bitcoin rallied +663% prior to Halving #1: Bitcoin rallied +383% prior to Halving #2: And Bitcoin rallied +343% prior to Halving #3: So while Bitcoin’s Pre-Halving #3 uptrend from ~$3,150 to $13,900 was historically normal pre-Halving price behaviour… Bitcoin’s price just to deviate beyond the Stock to Flow line during that period. happened Through the lens of the Stock to Flow model, this upside deviation in Bitcoin’s price was just Bitcoin’s way of simply the Stock to Flow line, as Bitcoin tends to do throughout it’s price history. trend-following The key takeaway here is that it’s not just about mere upside deviations in Bitcoin’s price beyond the Stock to Flow line viewed in a vacuum… It’s about the upside deviations that occur after the Halving event where the actual Stock to Flow of Bitcoin has been altered and in turn where most of the explosive growth in Bitcoin’s price occurs later in the Market Cycle. Most of the exponential growth in Bitcoin’s price occurs several months after the Halving. And the sixth Stock to Flow upside deviation that we’ll now cover is yet another testament to that. 6. Sixth Stock to Flow Upside Deviation Bitcoin Bull Market Peak (To Be Decided…) Here’s the time that Bitcoin’s price deviated to the upside, beyond the Stock-to-Flow line. sixth As of this writing, Bitcoin’s price has only just reached a new All Time High of ~$61,000. But here’s the problem - : Bitcoin’s price has not yet clearly deviated from the Stock to Flow line In fact, Bitcoin’s price is merely meandering along the Stock to Flow line. In early January 2021, Bitcoin briefly broke beyond the Stock to Flow line which was at a price point of ~$31,800: Shortly afterwards however, Bitcoin dipped below the Stock to Flow line before once again pulling up beyond it - but this time the Stock to Flow line was at a price point of ~$39,300: After that brief upside deviation however, Bitcoin’s price dipped once again but this time it actually treated the Stock to Flow line as a support at the price point of ~$45,300 before spring-boarding back up: What should we make of this? Most importantly - no clear upside deviation in Bitcoin’s price action beyond the Stock to Flow line has occurred. yet This means a few crucial things: Bitcoin’s price is still trend-following the Stock to Flow line As mentioned throughout the series, Bitcoin either deviates or the Stock to Flow line - or it just simply the Stock to Flow line, sometimes even perfectly tracing it. beyond below follows Bitcoin is currently still in the phase of its Bull Market where it simply follows the Stock to Flow line. But why is Bitcoin’s price trend-following the Stock to Flow line if Bitcoin’s price has been consistently increasing for the past several months? Because the Stock to Flow line is increasing. also The Stock to Flow model is still actively adjusting to Bitcoin’s newfound scarcity caused by the third Bitcoin Halving that took place in May 2020. The Stock to Flow line is still adjusting - and so is Bitcoin’s price. Which leads me to the next crucial insight: Bitcoin is still early in its current Market Cycle The Stock to Flow has proven itself to be a reliable predictor for Bitcoin’s future price trajectory. It’s almost as if the Stock to Flow is outlining the path for Bitcoin’s future price trajectory. In fact, there has never been a time in Bitcoin’s history where Bitcoin’s price would so closely follow the ascending Stock to Flow line - except for now: Generally, Bitcoin reaches the most euphoric portions of its Bull Market when it transitions away from following the Stock to Flow line and begins to actually deviate beyond it. This is when Bitcoin’s price becomes its most volatile but also appreciates at a rapid rate to reach euphoric new All Time Highs. The fact that Bitcoin’s price is still just the Stock to Flow line means that Bitcoin hasn’t yet reached the final, most euphoric phase of its Bull Market. following When Bitcoin’s price finally deviates from the Stock to Flow line, Bitcoin’s price will experience significant price expansion and rapidly accelerate in its uptrend. This is the period where the most exponential price increases occur. That being said, Bitcoin’s price hasn’t deviated beyond the Stock to Flow line - . yet Which leads us to the most important two questions: 1. When could Bitcoin’s price deviate beyond the Stock to Flow line? 2. And where could Bitcoin’s price deviate towards? Closing Thoughts This was Part 2 of the Stock to Flow series where we discussed the remaining three major upside Bitcoin price deviations from the Stock to Flow line: In of this Stock to Flow series, we’ll specifically cover the upside deviation from the Stock to Flow line in an effort to deduce when and where the upcoming Bitcoin price peak may take place. Part 3 sixth