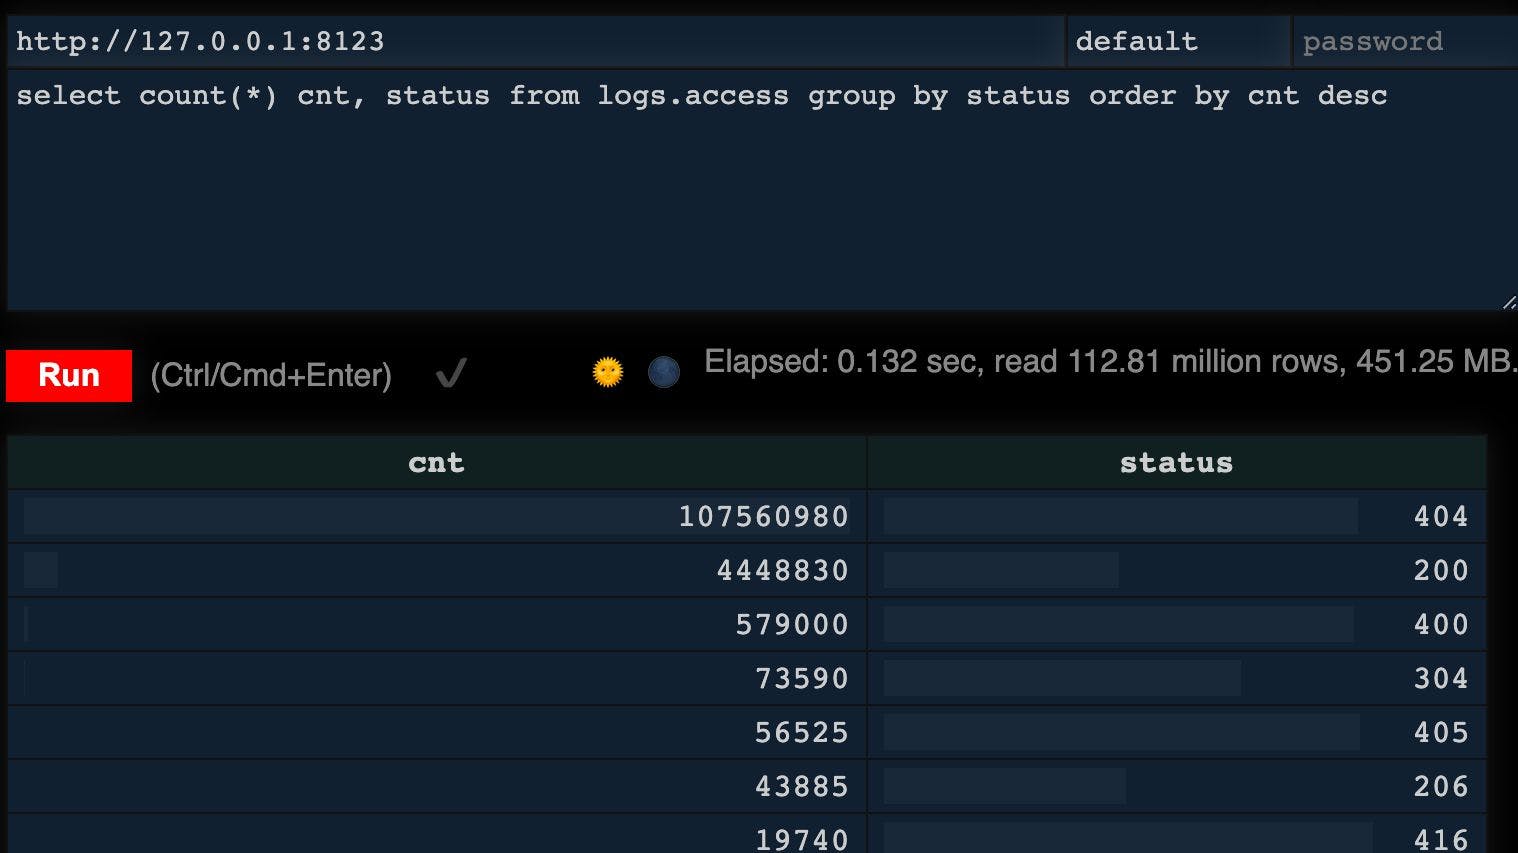
Occasionally you need to process some HTTP server logs and extract analytical data from them. It can happen that you don’t have an enterprise-grade log processing pipeline available, and it’s good to know how to process and extract data from logs manually, using tools that are already available or easy to bootstrap. Before going into details, there are two moments you should be aware of: Storage Space Logs are usually heavily compressed and can take a lot of space on your drive after decompression. For example, if you have a 10GiB archive with logs, expect it to take up to 5-7 times more space after decompression. And considering that method of processing can require additional space, I prefer to have up to 7-10 times more free space than compressed logs. The rule here is simple - the less space you have, the more time and effort it will take to process logs. There is also an option to decompress logs on the fly, but it will be slower than working with uncompressed files. Storage speed It is all about I/O when reading a lot of logs - the faster the storage is, the better. If your laptop or computer doesn't have an SSD and you plan to process tens of gigabytes of logs, it can take a lot of time. To measure how fast your storage is in a Linux environment, you can use the command (in my case, it's from on macOS). These numbers can tell you the best possible speed of processing. dd gdd coreutils gdd if=/dev/zero bs=1024k of=testfile count=1024 oflag=dsync && \ gdd if=testfile bs=1024k of=/dev/null count=1024 oflag=dsync && \ rm testfile 1024+0 records in 1024+0 records out 1073741824 bytes (1.1 GB, 1.0 GiB) copied, 0.987115 s, 1.1 GB/s // Writing 1024+0 records in 1024+0 records out 1073741824 bytes (1.1 GB, 1.0 GiB) copied, 0.147887 s, 7.3 GB/s // Reading Log Formats There are a lot of different log formats in the wild. One of the most widespread is the (CLF) - it is the default log format for Apache and Nginx HTTP servers. It's a plain text fixed format with the position of each field defined by a server's configuration. While this format is compact, it's not easy to read when unfamiliar with it, or the server's configuration differs from defaults. It can also be difficult to read by a machine. Here is an example of the Nginx server configuration and the log it produces: Common Log Format log_format combined '$remote_addr - $remote_user [$time_local] ' '"$request" $status $body_bytes_sent ' '"$http_referer" "$http_user_agent"'; ... 127.0.0.1 - - [19/Nov/2021:14:32:11 +0000] "GET / HTTP/1.1" 200 1664 "-" "curl/7.77.0" 127.0.0.1 - - [19/Nov/2021:14:32:11 +0000] "GET /teapot HTTP/1.1" 418 0 "-" "curl/7.77.0" 127.0.0.1 - - [19/Nov/2021:14:32:11 +0000] "GET /foo HTTP/1.1" 404 153 "-" "curl/7.77.0" Another format you may encounter is structured logs in JSON format. This format is simple to read by humans and machines. It also can be parsed by most programming languages. Example of the Nginx configuration and logs in JSON: log_format combined-json escape=json '{' '"remote_addr":"$remote_addr",' '"remote_user":"$remote_user",' '"time_local":"$time_local",' '"request":"$request",' '"status": "$status",' '"body_bytes_sent":"$body_bytes_sent",' '"http_referrer":"$http_referer",' '"http_user_agent":"$http_user_agent"' '}'; ... {"remote_addr":"127.0.0.1","remote_user":"","time_local":"19/Nov/2021:14:31:28 +0000","request":"GET / HTTP/1.1","status": "200","body_bytes_sent":"1664","http_referrer":"","http_user_agent":"curl/7.77.0"} {"remote_addr":"127.0.0.1","remote_user":"","time_local":"19/Nov/2021:14:31:28 +0000","request":"GET /teapot HTTP/1.1","status": "418","body_bytes_sent":"0","http_referrer":"","http_user_agent":"curl/7.77.0"} {"remote_addr":"127.0.0.1","remote_user":"","time_local":"19/Nov/2021:14:31:28 +0000","request":"GET /foo HTTP/1.1","status": "404","body_bytes_sent":"153","http_referrer":"","http_user_agent":"curl/7.77.0"} Command-line Tools When you need to extract and calculate some data from logs, Linux command-line tools are the first thing that comes to mind. These tools (or utilities) are not created specifically to process logs but are very flexible and powerful when combined together. And what is convenient - they are already available. Here are some examples of how tools like , , and others could be used. grep awk Find how many 405 Method Not Allowed responses are in a log file. time grep "\" 405 " access.log | wc -l 11305 ________________________________________________________ Executed in 58.56 secs fish external usr time 57.02 secs 0.27 millis 57.02 secs sys time 1.22 secs 1.32 millis 1.22 secs Notice extra characters around 405 - because CLF lacks structure, the pattern specifies value but also tries to limit where to look for it in a string. Same grep but without limiting returns a different result which is incorrect. grep "405" access.log | wc -l # Wrong result! 8824 Count how many of each status code is in a file, sorted by count in descending order. Output also shows another problem with CLF - splitting by space does not always work as expected, and you can get some amount of garbage in output. But for most cases, this should be ok. time awk '{print $9}' access.log | sort | uniq -c | sort -nr 21510839 404 889766 200 115696 400 14718 304 11305 405 8777 206 3948 416 3146 403 2908 411 1097 HTTP/1.0\" # Looks like log lines contained space in $remote_user field! 26 /vicidial/admin.php 26 /scripts/admin.php 26 /cgi-bin/admin.php 26 /admin.php 7 499 4 412 ________________________________________________________ Executed in 24.48 secs fish external usr time 30.88 secs 0.39 millis 30.88 secs sys time 1.99 secs 1.68 millis 1.99 secs As you can see, a command to select and aggregate data quickly becomes more and more complex. It also becomes difficult to debug, and some of the commands take a long time to complete. Anyway, it’s a good approach for simple one-off queries when working with a small number of logs. But if you are looking at 10+ GiB of logs and want to run rather complex queries, there is a better approach - convert semi-structured data to well-structured and use a database to run queries. Database The database is a great tool to work with data: It works with well-structured data, so no more garbage in results; Most databases use the same old to retrieve the data; SQL The database is pretty easy to set up when in a non-production environment; Queries generally run faster than reading a file from a disk because of how data is stored. Most developers are familiar with MySQL and PostgreSQL. They are great RDBMS and can be used to run analytical queries with some limitations. It’s just that most relational databases are not really designed to run queries on tens of millions of rows. However, there are databases specially optimized for this scenario - column-oriented DBMS. One good example is of such a database is . Let’s try it. ClickHouse To load logs to the database they need to be in a structured format that the database can understand. It means that logs in JSON can be directly loaded into the database. CLF logs need to be converted to CSV format. I find that the best way to do that is to use Perl and regular expression: perl -ne 'print if s/^(.*?) - .*? \[([^:]*?):(.*?) .*?\] "(.*?) (.*?) (HTTP\/.*?)" (.*?) (.*?) "(.*?)" "(.*?)"$/$1,"$2 $3",$4,"$5",$6,$7,$8,"$9","$10"/g' < access.log > access.csv For the purpose of running some analytical queries on your laptop you don’t need to invest a lot of effort into configuring a database server - just download the server and run it from a command line. # MacOS x86_64 curl -O 'https://builds.clickhouse.com/master/macos/clickhouse' && chmod a+x ./clickhouse # Create directory for ClickHouse data files/directories mkdir data # Clickhouse will use the current directory to create files cd data # Start the server ./../clickhouse server Processing configuration file 'config.xml'. There is no file 'config.xml', will use embedded config. Logging trace to console 2021.12.31 19:49:27.682457 [ 3587768 ] {} <Information> : Starting ClickHouse 21.12.1.8928 with revision 54457, no build id, PID 14099 In the new console connect to the server and create a database and table for our log file. ./clickhouse client --multiline ClickHouse client version 21.12.1.8928 (official build). Connecting to localhost:9000 as user default. Connected to ClickHouse server version 21.12.1 revision 54451. :) CREATE DATABASE IF NOT EXISTS logs; CREATE DATABASE IF NOT EXISTS logs Query id: 3c376c00-1969-41df-af0c-099174e2e32b Ok. 0 rows in set. Elapsed: 0.002 sec. :) CREATE TABLE IF NOT EXISTS logs.access :-] ( :-] remote_addr String, :-] time_local DateTime, :-] request_method String, :-] request_uri String, :-] http_version String, :-] status Int32, :-] body_bytes_sent Int64, :-] http_referrer String, :-] http_user_agent String :-] ) :-] ENGINE = MergeTree() :-] ORDER BY tuple(); CREATE TABLE IF NOT EXISTS logs.access ( `remote_addr` String, `time_local` DateTime, `request_method` String, `request_uri` String, `http_version` String, `status` Int32, `body_bytes_sent` Int64, `http_referrer` String, `http_user_agent` String ) ENGINE = MergeTree ORDER BY tuple() Query id: 501fa6b3-a16e-4c97-bb40-2d7d58b997ba Ok. 0 rows in set. Elapsed: 0.005 sec. :) ^C :) Bye. Now let’s load our data and run some queries. # Load data to logs.access table from csv file ./clickhouse client --date_time_input_format='best_effort' --query="INSERT INTO logs.access FORMAT CSV" < access.csv Find how many 405 Method Not Allowed responses there are :) SELECT count() FROM logs.access WHERE status=405; SELECT count() FROM logs.access WHERE status = 405 Query id: 76b40738-354c-4ad0-a815-6bf9e211fb54 ┌─count()─┐ │ 11305 │ └─────────┘ 1 rows in set. Elapsed: 0.037 sec. Processed 22.56 million rows, 90.25 MB (607.73 million rows/s., 2.43 GB/s.) Count how many of each status code there are, sorted by count in descending order. :) SELECT count(), status FROM logs.access GROUP BY status ORDER BY count() DESC; SELECT count(), status FROM logs.access GROUP BY status ORDER BY count() DESC Query id: f9d01465-54ca-4e73-a961-be2f695ded91 ┌──count()─┬─status─┐ │ 21512196 │ 404 │ │ 889766 │ 200 │ │ 115800 │ 400 │ │ 14718 │ 304 │ │ 11305 │ 405 │ │ 8777 │ 206 │ │ 3948 │ 416 │ │ 3146 │ 403 │ │ 2908 │ 411 │ │ 7 │ 499 │ │ 4 │ 412 │ └──────────┴────────┘ 11 rows in set. Elapsed: 0.045 sec. Processed 22.56 million rows, 90.25 MB (502.02 million rows/s., 2.01 GB/s.) Now you can play with data without waiting endlessly for each query to complete. Enjoy!


![10 FinTech Trends in 2021 [Part II]](https://firebasestorage.googleapis.com/v0/b/hackernoon-app.appspot.com/o/images%2F3nhao37bBEfHA9RTQ0WNVWfXPD02-ern31d7.jpeg?alt=media&token=f48ef9e5-ec15-4bfe-93cf-9a84dfb77f84&auto=format&fit=max&w=3840)