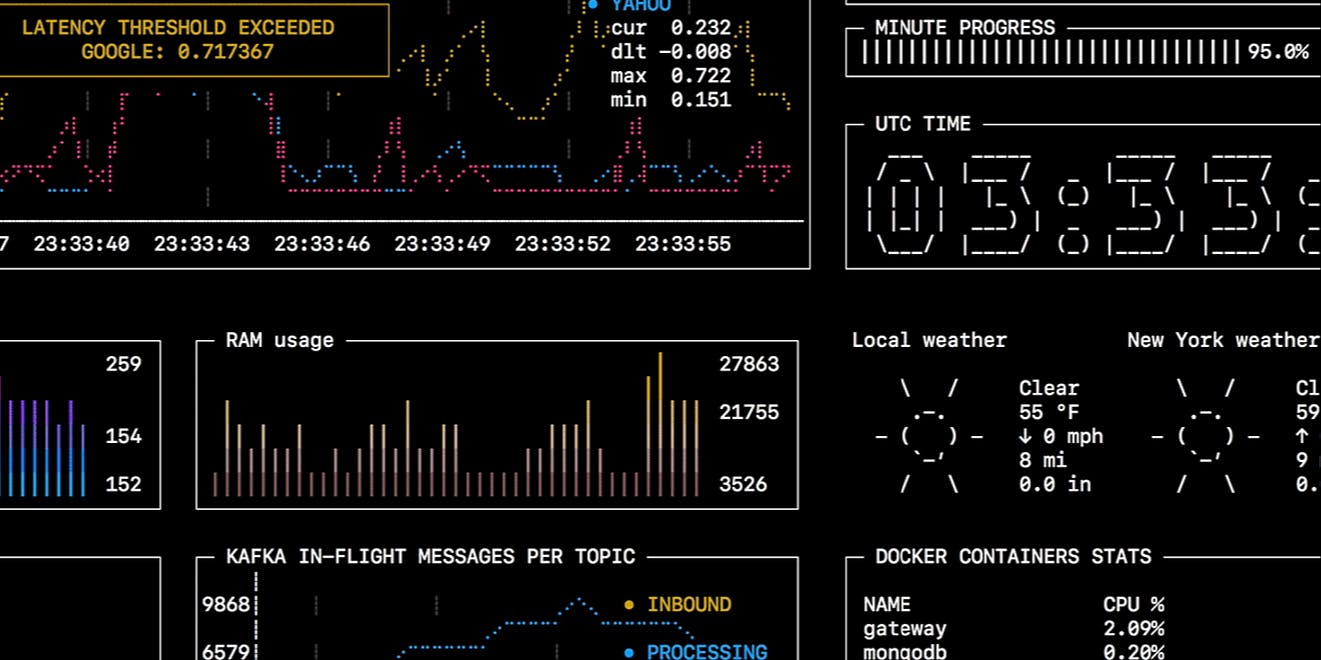
As a backend developer, I always need to monitor something. State machine in the database, records count, message queue lag, custom application metrics, system performance, progress of my deployment scripts. Tons of stuff! For a long time I was trying to find a tool which can save me time — will be able to keep everything in one place, and notify me when needed. Heavy production monitoring systems can't help with the development tasks, I needed a swiss army knife - something that can be configured in a minute and give me the results right away. There were no such thing, so I wrote my own. Meet Sampler - command-line UI for any shell commands, written in pure Go. For installation, just follow the instructions for macOS, Linux or Windows How does it work? The idea is very simple - almost all metrics you might want to monitor and visualize are available through the CLI: The obvious ones: CPU, memory, disk space, network Telemetry from a remote machine via SSH Any database metrics and results of your custom queries Kafka, RabbitMQ, ActiveMQ Everything available via http, e.g. Spring Boot Actuator metrics Docker JMX That means we can create our dashboards without complex integrations, drivers and dependencies. We can do it right from the terminal. Using Sampler is basically a 3-step process: Define your configuration in a YAML file Run sampler -c your-config-file.yml Adjust components size and location on UI Examples. Visualizations and their YAML configuration Runchart runcharts: - title: Search engine response time rate-ms: 500 # sampling rate, default = 1000 scale: 2 # number of digits after sample decimal point, default = 1 legend: enabled: true # enables item labels, default = true details: false # enables item statistics: cur/min/max/dlt values, default = true items: - label: GOOGLE sample: curl -o /dev/null -s -w ' ' %{time_total} https://www.google.com color: 178 # 8-bit color number, default one is chosen from a pre-defined palette - label: YAHOO sample: curl -o /dev/null -s -w ' ' %{time_total} https://search.yahoo.com - label: BING sample: curl -o /dev/null -s -w ' ' %{time_total} https://www.bing.com Sparkline sparklines: - title: CPU usage rate-ms: 200 scale: 0 sample: ps -A -o %cpu | awk '{s+=$1} END {print s}' - title: Free memory pages rate-ms: 200 scale: 0 sample: memory_pressure | grep 'Pages free' | awk '{print $3}' Barchart barcharts: - title: Local network activity rate-ms: # sampling rate, = scale: # number digits after sample decimal point, = items: - label: UDP bytes sample: nettop -J bytes_in -l -m udp | awk - label: UDP bytes out sample: nettop -J bytes_out -l -m udp | awk - label: TCP bytes sample: nettop -J bytes_in -l -m tcp | awk - label: TCP bytes out sample: nettop -J bytes_out -l -m tcp | awk 500 default 1000 0 of default 1 in 1 '{sum += $4} END {print sum}' 1 '{sum += $4} END {print sum}' in 1 '{sum += $4} END {print sum}' 1 '{sum += $4} END {print sum}' Gauge gauges: - title: Minute progress rate-ms: # sampling rate, = scale: # number digits after sample decimal point, = percent-only: # toggle display the current value, = color: # -bit color number, one is chosen a pre-defined palette cur: sample: date +%S # sample script current value max: sample: echo # sample script max value min: sample: echo # sample script min value - title: Year progress cur: sample: date +%j max: sample: echo min: sample: echo 500 default 1000 2 of default 1 false of default false 178 8 default from for 60 for 0 for 365 0 Textbox textboxes: - title: Local weather rate-ms: # sampling rate, = sample: curl wttr.in? ATQF border: # border around the item, = color: # -bit color number, is white - title: Docker containers stats rate-ms: sample: docker stats --no-stream --format 10000 default 1000 0 false default true 178 8 default 500 "table {{.Name}}\t{{.CPUPerc}}\t{{.MemUsage}}\t{{.PIDs}}" Asciibox asciiboxes: - title: UTC time rate-ms: # sampling rate, = font: d # font type, = d border: # border around the item, = color: # -bit color number, is white sample: env TZ=UTC date +%r 500 default 1000 3 default 2 false default true 43 8 default There is more! Interactive shell support, PTY mode, triggers, alerts and variables. Real-world recipes to work with MySQL, PostgreSQL, MongoDB, Neo4J, Kafka, SSH and JMX. You can read all about advanced capabilities . in the documentation Don't hesitate to ask questions, contribute and ⭐ star ⭐ the project ! on Github


![Set Up Data-Driven Alerts in Google Analytics [A How To Guide]](https://hackernoon.imgix.net/images/2t1i3229.jpg?auto=format&fit=max&w=3840)
