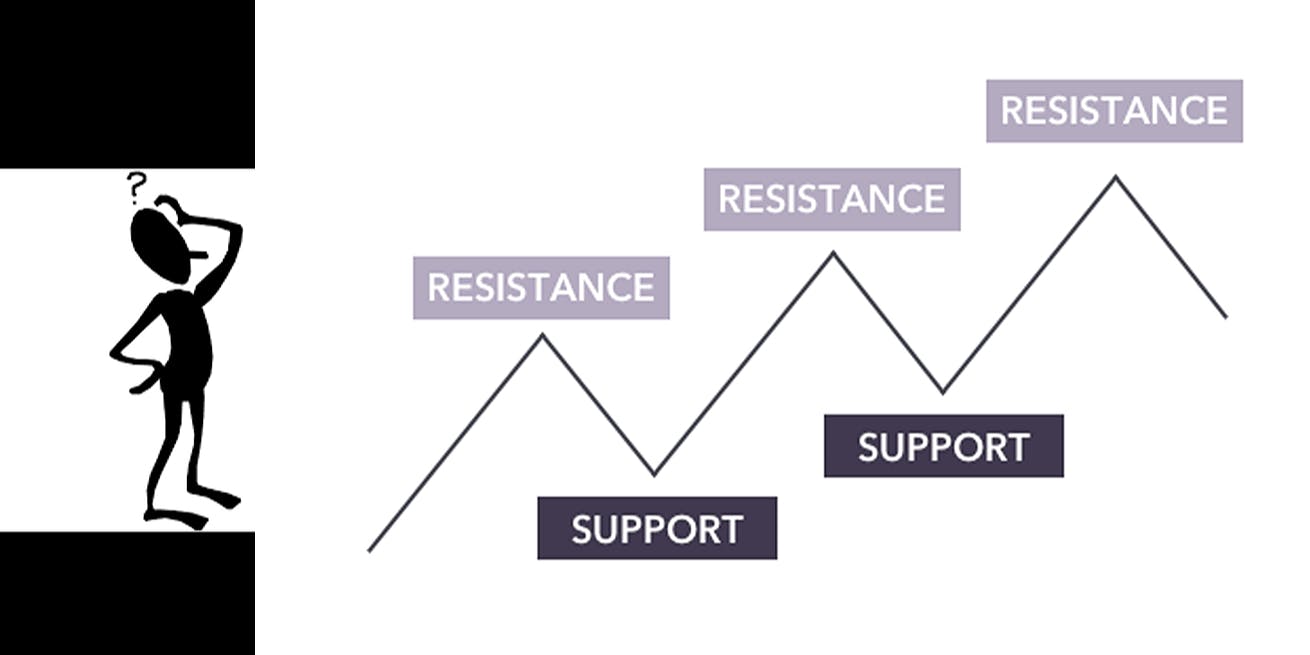
Support and resistance are two of the best established concepts in technical analysis trading strategies. Conceptually, both support and resistance identify pricing points on an asset that favor a pause or reversal of a given trend. In traditional technical analysis, there are several indicators that model out points of support and resistance all of them are solely based on price trends. Many of those techniques can be extrapolated it to crypto-assets but I think we can do a bit better. For the first time in history, we have an asset class that records parts of the behavior of individual investors and asset holders in public ledgers. That information results a gold mine when comes to estimate objective levels of support and resistance.
Support and resistance indicators are typically used to track the end or reversal of a price trend. From that perspective, support represent price level that the asset will not fall below. Resistance is a price level that the asset can’t seem to rise above. More specifically, support occurs where a downtrend is expected to pause, due to a concentration of demand. Resistance occurs where an uptrend is expected to pause temporarily, due to a concentration of supply.
As illustrated in the previous figure, support and resistance levels are represented using trend lines. For instance, when the market is trending to the upside, resistance levels are formed as the price action slows and starts to pull back toward the trendline. This occurs as a result of profit taking or near-term uncertainty for a particular issue or sector. Those levels are typically known as zones are a core element of trading strategies. For instance, when the price of an asset is approaching a resistance zone, it can either break through those levels of bounce back to previous levels. Those hypotheses are used as the basics for modeling entry and exit points in trading strategies.
One of the elements that makes support and resistance indicators so popular among traders, it that it appeals to the psychology of traders. Let’s take the example of a security that is trending closer towards a support zone. In that scenario, the traders who are long are happy and may consider adding to their positions if the price drops back down to the same support level. The traders who are short in this situation are beginning to question their positions and may buy to cover (exit the position) to get out at, or near, breakeven if the price reaches the support level again. The traders who did not enter the market previously at this price level may be ready to pounce and go long if the price comes back down to the support level. All those psychological games result on a large number of traders may be eagerly waiting to buy at this level, adding to its strength as an area of support. If the price is able to break through the levels of support, it might signal the beginning of a new trend downwards.
One important concept about support and resistance zones is that they can shift. This means that previously acted as support will eventually become resistant. Conversely, levels that formed resistance will act as support, once price breaks above the resistance level.
In technical analysis, there are many indicators that reflect levels of support and resistance. Fibonacci Retracements, Wolfe Waves, Camarilla Pivots, Murrey Math Lines are some of the popular indicators that express levels of support and resistance. All those indicators simply estimate support and resistance zones by evaluating mathematical expressions over price and volume metrics. Sort of predicting price with price 😉. The advent of crypto-assets offers a richer data ecosystem that can enable more efficient models to calculate support and resistance.
The estimation of support and resistance zones is solely based on inferring levels of concentration or buying and selling power among the investors of a specific asset. However, support and resistance indicators have no way of objectively estimating those levels as they don’t have visibility into the behavior of individual investors. In the absence of that data point, support and resistance indicators are reduced to identify past price trends and assume those will repeat themselves in the future. Now imagine, if we could extend support and resistance indicators with information about the investor concentration at a given price point.
Blockchains record several data points that are statistically relevant indicators of the behavior of crypto-asset holders. From individual transactions to addresses, blockchain dataset offer many interesting nuggets of information that can complement traditional support and resistance analysis. Let’s look at a practical example.
The In-Out of the Money analysis is a machine learning technique included in the IntoTheBlock platform that estimates relevant token holder groups with respect to the current price. Without getting into a machine learning class, the In-Out of the Money signal uses clustering models to identify groups of token holders that share similar positions relative to the current price of a cypto asset. The visualization of the In-Out the Money for Bitcoin and Ethereum looks like the following:
How is the In-Out of the Money method relevant to the estimation of support and resistance levels? Well, imagine that in addition to the historical price and volumes, we can factor in the levels of concentration of the clusters of individual investors. In its most extreme representation, we can argue that the In-Out of the Money by itself could represent objective indicators of support and resistance. For instance, in the case of the following Ethereum In-Out analysis, we can drive some intriguing conclusions:
· If the price of Ethereum goes up to around $201, there is a base group of 2,860,000 addresses that, given that they are loosing money, they might become sellers adding to the level of resistance. Similarly, there is another group of approximately 880,00 addresses that might contribute sellers also interested on capitalizing gains.
· If the price of Ethereum goes down to around $168, there is a group of about 2,120,000 addresses that might become buyers to avoid covering potential losses. Similarly, there is a group of 880,000 addresses that might act as buyers contributing to the support level.
The previous analysis is an interpretation of the In-Out of the Money by itself to estimate levels of support and resistance. More sophisticated analysis could incorporate adapted versions of techniques such as Fibonacci Retracements factoring in the concentration of addresses in or out of the money.
The are several techniques similar to the In-Out of the Money that can help to estimate levels concentrations around the price level. While this information is not exact due to some of the manipulations of centralized exchanges, it is definitely statistically relevant. Bottom line, evaluating support and resistance factoring in historical price, volume and distributions of concentration is better than just using price and volume.
More about this in a future post.