186 reads
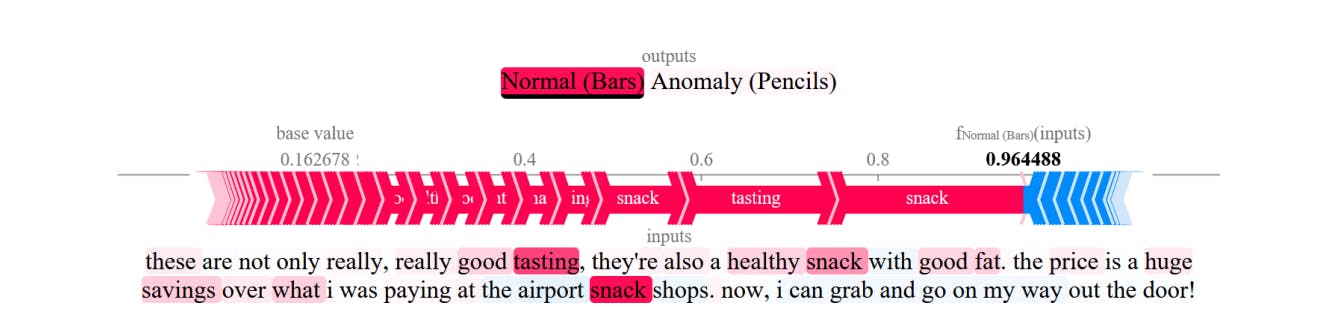
Real-World Evaluation of Anomaly Detection Using Amazon Reviews
by byWritings, Papers and Blogs on Text Models@textmodels
We publish the best academic papers on rule-based techniques, LLMs, & the generation of text that resembles human text.
June 28th, 2024


Audio Presented by
We publish the best academic papers on rule-based techniques, LLMs, & the generation of text that resembles human text.
Story's Credibility


We publish the best academic papers on rule-based techniques, LLMs, & the generation of text that resembles human text.
Story's Credibility
About Author

We publish the best academic papers on rule-based techniques, LLMs, & the generation of text that resembles human text.
Comments