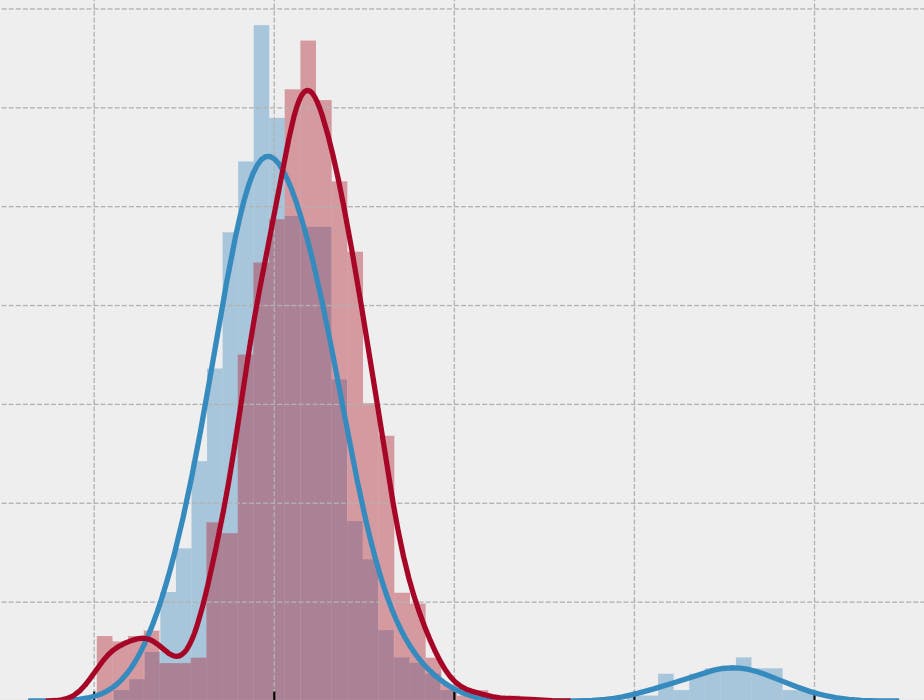
This is a simple method for outlier detection, the procedure basically is a Quantile of weibull distribution of the chi square test in python. We may have some small series of data like stock, rolled product thickness, etcetera; sometimes the data is collected manually and we need to detect outliers as a first filter to detect human errors in the collected data and correct them before analysis, in other cases, the data must need be broken down by season, process, etc. I understand that doing a clustering like a Gaussian mixture for outlier detection or something like that on each variable is too expensive, and Chi squared is computationally cheaper. The first question is why each part of this process? The proposed approach to this problem is simply to find an observation error, and for that the problem is built on a calculation of . The procedure is composed of: Measurement’s Accuracy Chi Square test: It can be used to test if the variance of a population is equal to a specified value. Weibull Distribution: it can also model skewed data. Quantile function: probability distribution of a random variable. We cannot establish outlier fences by calculating the interquartile range because this can be used across products and seasons of a diverse nature. But then you can use a simple Chi-square test and look for errors of observation. We can continue as a little recipe. The Recipe: The first step is display the density of the variable in question. 2. Measurement’s Accuracy calculation, the classical procedure exposed in the Kalman filter substract the median to the value; i divide the value between the median to make a normalized non-dimentional measure: https://gist.github.com/devicemxl/3bcdb35be4451ae7767b1e555ca7722d#file-measurementaccuracy-py?embedable=true Moving Chi-square series (χ2), allows us to create a constantly updated chi-square sequence and thereby obtain easily groupable values https://gist.github.com/devicemxl/04b5658416bb642487ed9522c11eeb9c#file-movingchi-square-py?embedable=true 4. Quantile (Q); each business variable have their sole ranges, in this case i select the 95° quantile because is tent to be a flat range variable. 5. Classify; with the value in Q we can classify the χ2 returns: https://gist.github.com/devicemxl/5f254d5c65232d3755a7fa5fb8663140#file-classifychi-py?embedable=true 6. Vualá! With this we split noise and data of a non linear variable: Here we implement a very simple outlier detection process, this has a bit more potential; In a few days I will write another post on this subject. source code: https://github.com/devicemxl/Chi-Square-for-Outliers?embedable=true Sources and further reading: Original Dataset @ Hochschule Luzern Empirical Methods Handbook of Statistical Methods Introduction to Statistical Quality Control by DOUGLAS C. MONTGOMERY, 6° Edition Some rights reserved Questions and comments are always welcome Also Published Here