1,070 reads
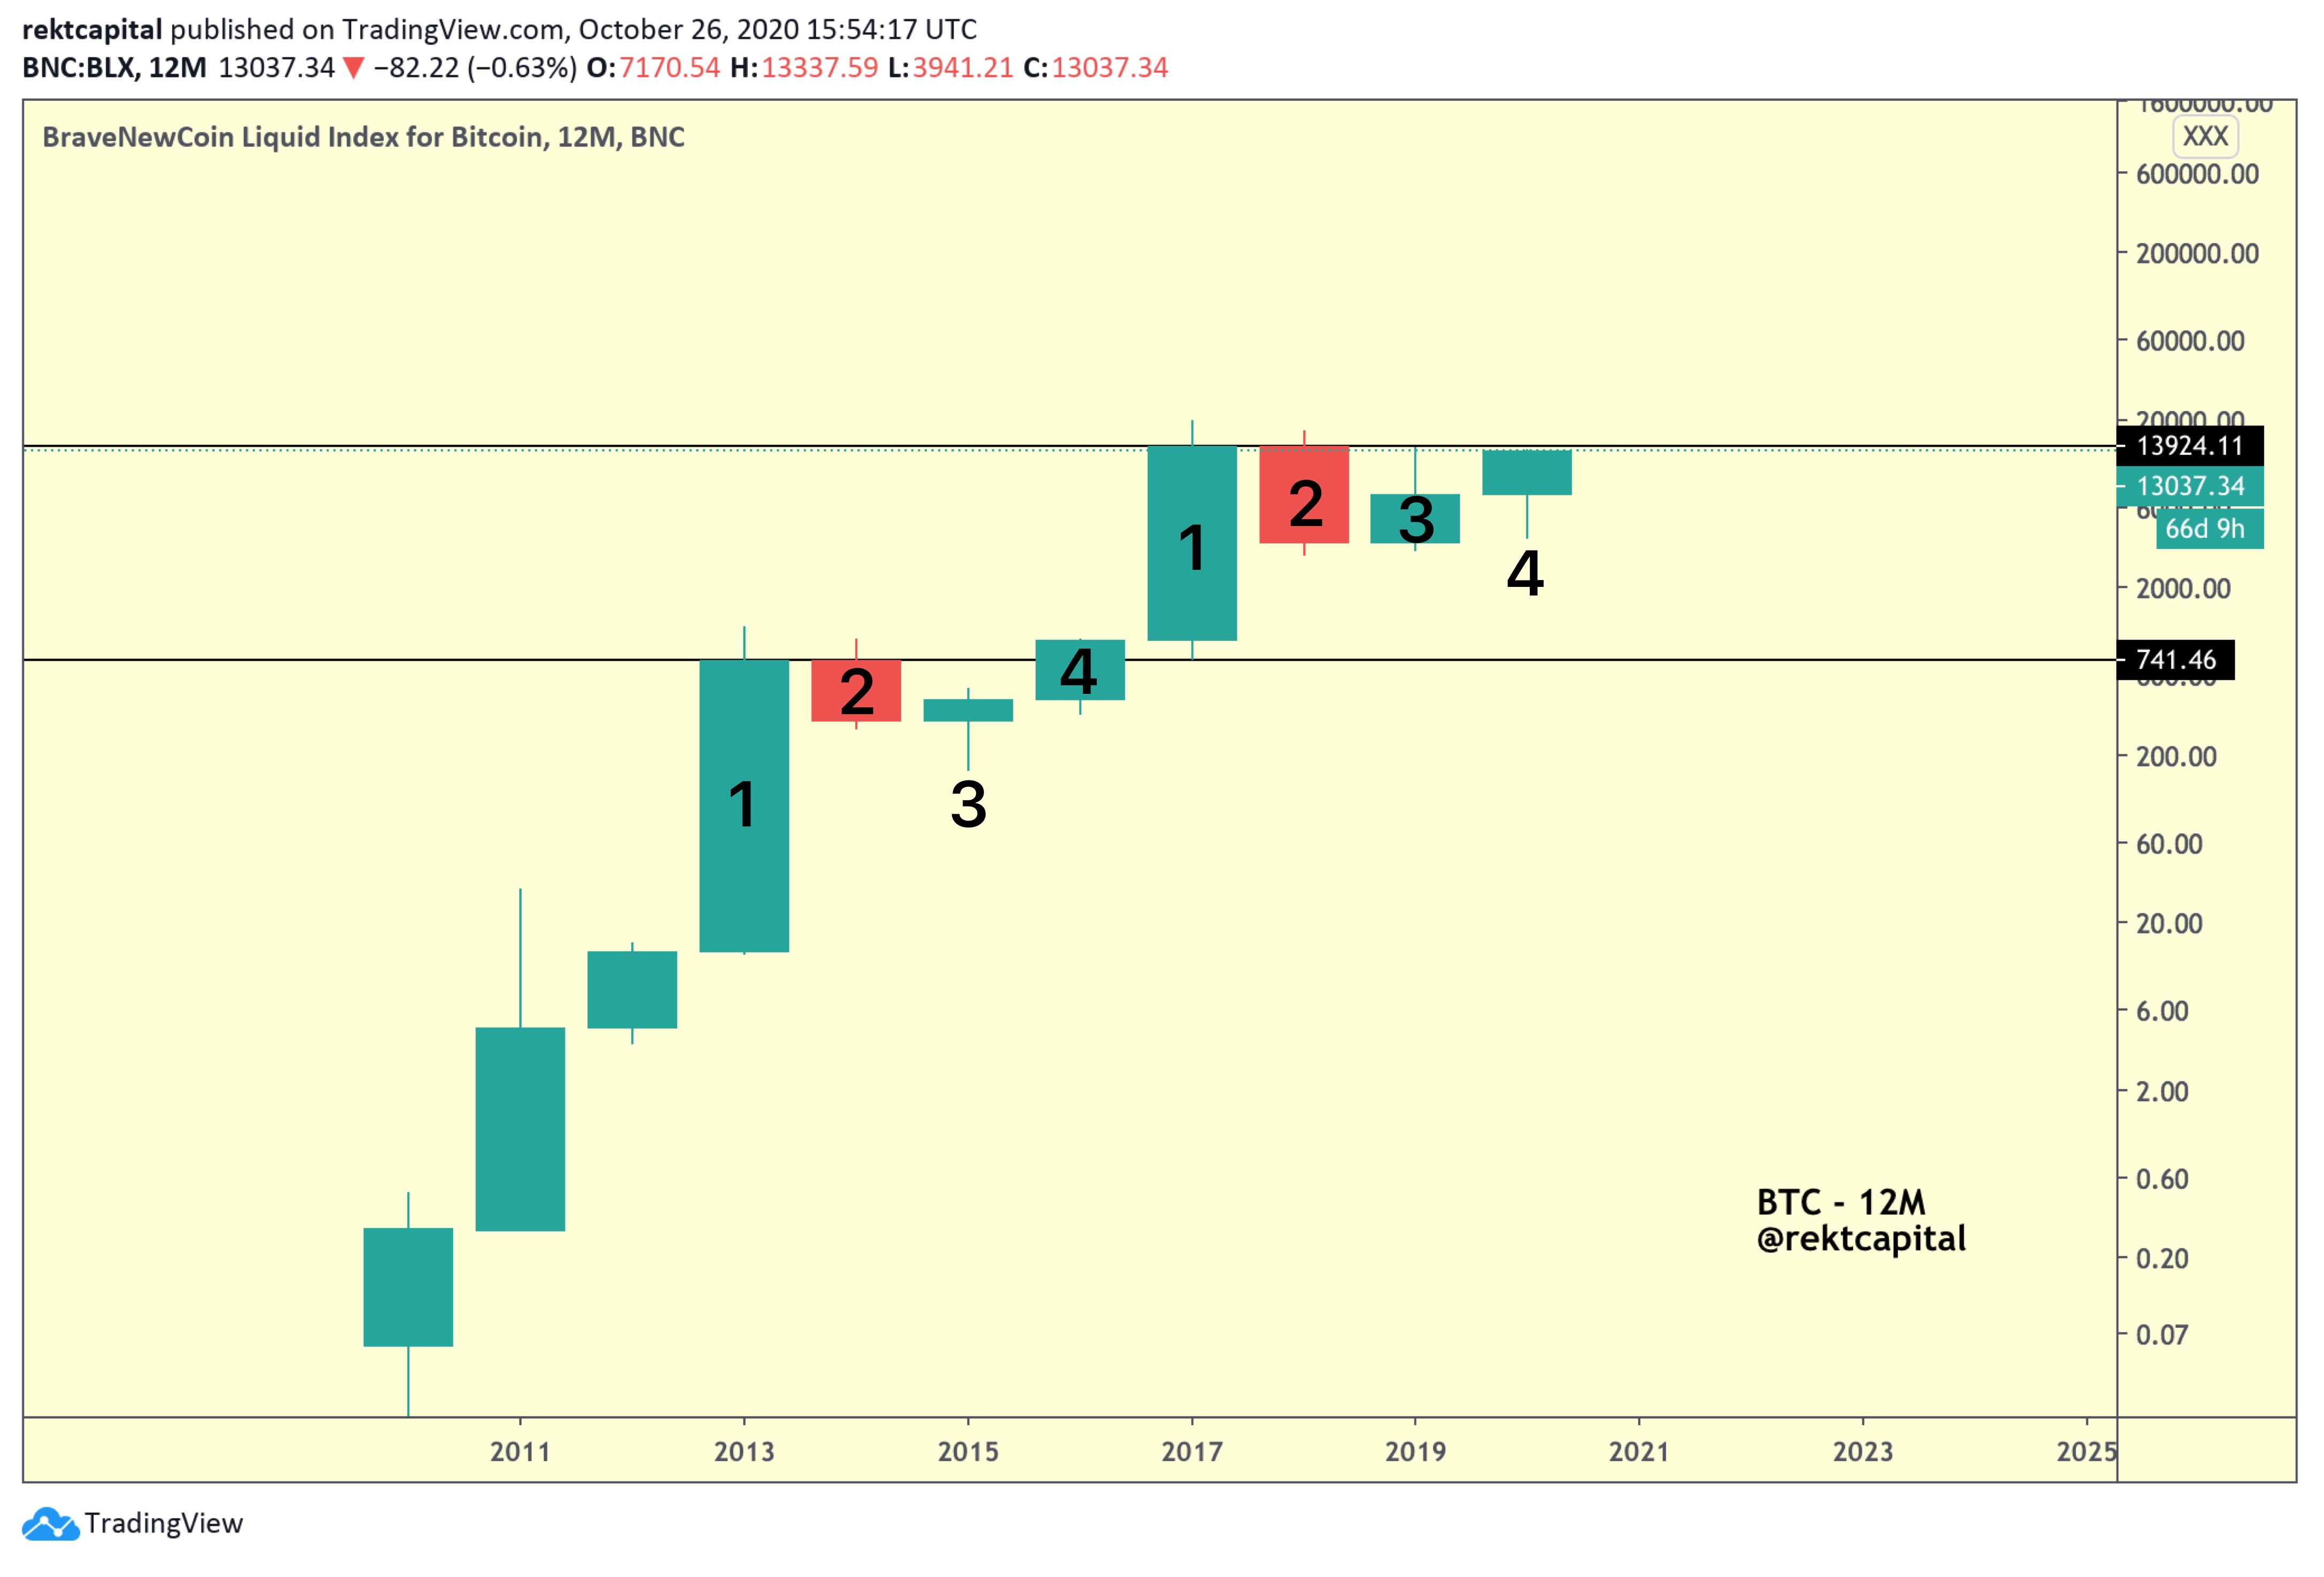
Measuring The Bitcoin Peak Using Data Science: Stock-To-Flow Deviations - Part 1
by
March 20th, 2021


About Author

Cryptocurrency trader. Author of the Rekt Capital Newsletter
Comments

Cryptocurrency trader. Author of the Rekt Capital Newsletter