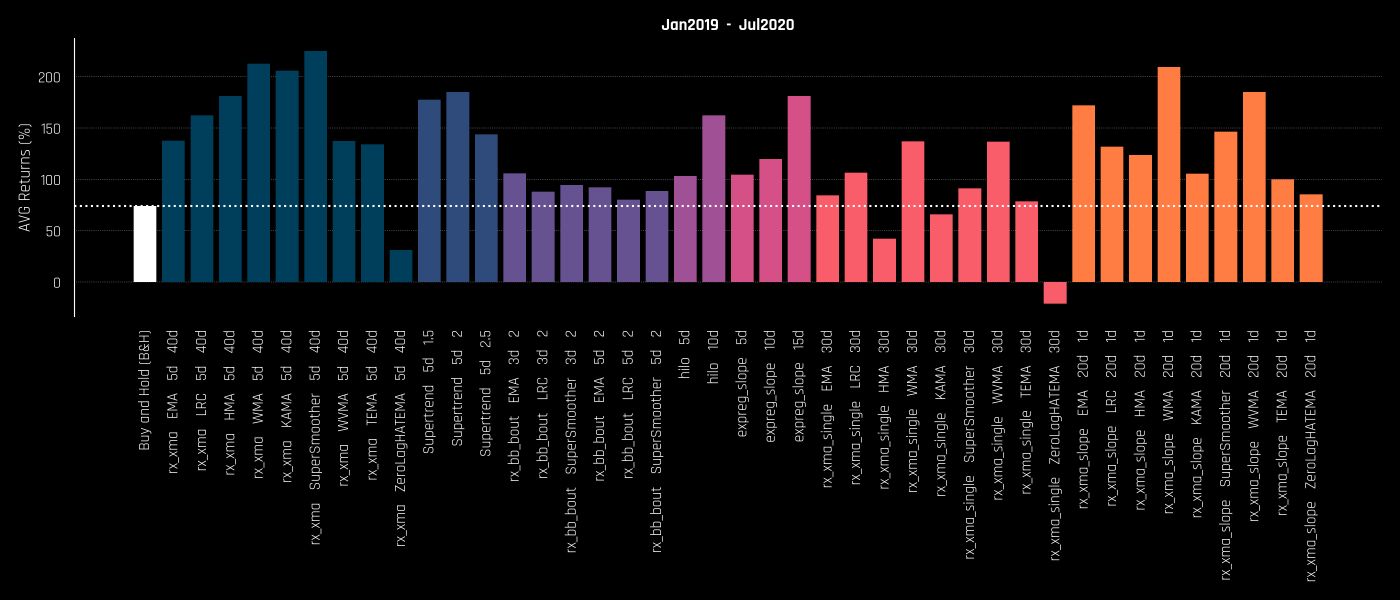
There are a lot of these proverbs that get thrown around the trading community like “ ”, “ ”, “ ”, “ ” etc. Yes, intuitively they sound about right, but how much truth there really is behind them? cut your losses short, let your winners run buy the dip never add to a losing trade don’t try to catch a falling knife I don’t like such general statements without proof. Especially when money is on the line. I need statistical validation. Today I’m going to show you, that holding might not be the best option if you put in a little bit of work. I’ll try to attack/test one of my least favorite assumptions — “Buy and Hold is the best strategy”. To do that, I’ll compare Buy and Hold (B&H from now on) returns for 25 coins with several basic strategies in different time periods: Jan 2017 — Jul 2020 Jan 2018— Jul 2020 Jan 2019 — Jul 2020 Just so we don’t compare apples to oranges, I won’t be using any advanced strategies. I will compare B&H to simple, basic, well-known trend following strategies that require a few minutes/hours to code. To make this comparison as fair as I possibly can, I fill analyze results in groups based on different date ranges and therefor — different market regimes. It’s very difficult to beat a pure bull market that has diagonal/parabolic trajectory because it offers very few pullbacks to give any chance to beat B&H by a reasonable margin. As you will see, the difficulty to beat B&H depends heavily on the market regime in that time period. Coins used I will use 25 of the ~TOP50 coins. Since we need coins with at least a few years of history, we can’t use most of the hot new DeFi coins like , , , etc. COMP LEND SNX KNC, I will use 3 different date ranges. Specific coins for each date range depend on data availability. Some will use partial range data (starting later), specified in parentheses. Jan 2017 — July 2020 Coins used: , , (since May 18, 2017), , (since Aug 1, 2017), , (Apr 12, 2017), , , (since May 1, 2017), (since Jun 12, 2017), XBT ETH XRP LTC BCH XMR DASH ETC ZEC GNO IOT REP Jan 2018 — July 2020 Coins used: all of the above + BNB, EOS, XLM, ADA, TRX, NEO, OMG Jan 2019 — July 2020 Coins used: all of the above + BSV, XTZ, LINK, ONT, QTUM, QSH Strategies used I will use my implementation (except for , which I found ) of several . Supertrend here basic/standard trend following strategies All strategies will be tested with , except for , which will use 1440m (1d), because I wanted to use daily ATR values. 60m candle size Supertrend I’ll use some and other parameters — a few days to few weeks, depending on the meaning of parameter. For example, MA crossover fast MA = days (like 5) and slow MA = weeks (like 40 days) reasonable/round values for period lengths In parenthesis I’ve noted the name I’m using in my platform and also in charts. , I’ve given small description for going long when the reverse happens, the position is closed (no shorting). For some I will use multiple parameter variations, they will show as separate strategies in charts. All strategies are long only ( )— when slow MA crosses over fast MA, go long. I will also use several different MAs for this — EMA, LRC (LinReg), HMA, WMA, KAMA, SuperSmoother, WVMA, TEMA, ZLEMA. MA Crossover rx_xma Parameters used: fast MA = 5d, slow MA = 40d ( ) — uses ATR to get band width, goes long if price over the band. Supertrend SupertrendXm Parameters used: ATR period = 5d, band multiplier = 1.5/2/2.5 ( ) — goes long when price over upper band. Bollinger Bands Breakout rx_bb_bout Parameters used: BB period = 3d/5d, BB stddev = 2, MA = EMA/LRC/SuperSmoother ( ) — goes long when price over previous X days high. Close position when under X days low. High/Low Breakout hilo Parameters used: period = 5d/10d ( ) — goes long when slope of regression > 0. Linear Regression Slope expreg_slope Parameters used: reg period = 5d/10d/15d ( ) — goes long when price crosses over MA. Same MAs as will be used (EMA, LRC, etc). Single MA/Price Crossover rx_xma_single rx_xma Parameters used: reg period = 30d ( ) — goes long when slope of MA > 0. Same MAs as will be used. Single MA Slope rx_xma_slope rx_xma Parameters used: MA period = 20d, slope period = 1d I’ve uploaded strategy sources . Since I’m no longer using platform, they will not be runnable directly but my code should give you enough idea about how to implement it in your chosen platform. here Gekko Testing setup Long only. 0.10% commission. Simple condition for entry (long), reverse for exit (close). No stoplosses or take profits. Use 100% of balance on each trade. B&H performance over the years Before we dive into results, I just want to give a quick context on how the market was performing over my chosen periods, so we have a better feeling about what we are comparing against. I’ll plot and price lines, they represent the overall market pretty well. BTC ETH I won’t dive into too much, we all know how it went — pure ecstasy mixed with some gut-wrenching pullbacks well over 30%. 2017 started as “ ”, but soon turned into one bull trap after another, until the market eventually lost hope and went into depression and on its way to inevitable 0 (as the general public was thinking at the moment) 2018 last chance to get BTC under 20K, moon inevitable . started with a nice solid uptrend that went on almost half a year when the parabolic trend was broken and huge volatility came in and we saw some difficult market. After that, it calmed down and we started to see a slow and stable downtrend, except for a weird flash pump at the end of October. 2019 Start of resembled the start of 2019 very much — a strong and solid trend was forming that looked unstoppable just before it wasn’t. COVID fears settled in and after a few smaller dumps, on March 12 it all came crashing down to long-unseen lows ( under 4000, etc). What looked like the start of the end of the World, Markets, and Crypto, turned out to be the absolute low, at least (hopefully) for now. While everyone was waiting for the next dump and everything turning to 0, the bottom was already in and one of the strongest trends was starting to form. A lot of people were calling it a Bull Trap, but somewhere around the start of May things started to look real. Not long after that broke the huge emotional barrier of 10K again just to come crashing down a day later to start one of the most boring Crypto months we’ve ever seen. Then, just when it looked like this was over and a huge dump is in the cards, sliced through the 10K like it was nothing and never looked back. 2020 BTC BTC BTC Results Jan 2019 — Jul 2020 Let’s start with the most recent date range. As we all know, this was the awakening after a long and dark winter that went throughout 2018. Holding was good here, a lot of coins showed good jumps from their 2018 lows. On average (considering the 25 coins I used for this range) B&H returns were 80%. returned 147%, 72%, meanwhile was down 50%. Also, we had some like (400%+) and (770%+). BTC ETH XRP mooners XTZ LINK : I started with charting all coins separately but realized it’s hard to compare, so I’ll show averages over all coins in the chart. , so if you want a more detailed inspection of results, I suggest to throw this into Google Sheets and do some grouping/pivots of your own. NOTE I’ve uploaded all the runs I made in Github repo Here are the average returns (over all coins) of all strategies tested: Ok, so from 41 strategies/combos that I tested: 4 lose to B&H 37 beat B&H 9 of those 37 are relatively close (within 20% returns difference) 12 are more than x2 (160%+ returns vs B&H 80%) Pretty conclusive if you ask me. : Please don’t take away from this that LRC is better than EMA or SuperSmoother is the best MA or anything like that. You could try another slow/fast combination like 5d/20d and come up with another “best” MA. Comparisons like that are useless. NOTE For those of you who want a bit more detailed picture, here is a stacked version (by coins), so you can see which coins added the most to returns (as expected, those were the big gainers — , , etc). BTW chart is total returns, not average. XTZ LINK BNB, There are 2 big outliers with amazing B&H returns — (>400%) and (>770%) and they skew the averages in their favor. Let’s filter them out and see if we get a different picture (for non-stacked). XTZ LINK AVG returns drop from 80% to 30% and overall strategy dominance over B&H increases noticeably. Results Jan 2018 — Jul 2020 This is one of the most painful periods for B&H you can pick (except for pure 2018 Jan — Dec) for comparison. You bought at the absolute top, soon everything was deeply red and there was no hope in sight until the start of Jan 2019. As expected, everything beats B&H (-72%): What’s surprising is that only 4 strategies are negative. 9 are in the range of 0–30% returns. 11 are in the range 30–50%. 10 are in the range 50–70%. 7 are in the range of 70%+. Overall, looks like MA Crossover is showing the best results while BB Breakout is the most consistent. Here is the stacked chart: Results Jan 2017 — Jul 2020 This is where I though B&H would shine. Such simple strategies shouldn’t be able to beat one of the best markets this world has ever seen with such heavy tailwind, right? You basically bought at the absolute bottom and saw at least 10x gains in first year. Well … Most of the strategies are heavily outperforming B&H. x2 — x3 on average overall. MA Crossover beats it multiple times (~5x) Same for Supertrend (~5x) BB Breakout is close, but still at least 50% vs B&H HiLo is around 2x LinReg slope is around 2x Single MA is either close or 2x better depending on period MA Slope is 2x — 3x better than B&H As we can see, dominates returns so heavily that it makes all the other coins and results way less significant. Let’s take a look at results that could change picture (non-stacked). ETH without ETH, Turns out it doesn’t change much, filtering out only increases the dominance over B&H a bit. Yes, the AVG returns are smaller (of course), but the proportions of the bars are very very similar to the chart above. ETH Here is the stacked version. Extra results Jan-Dec 2017 and Jan-Dec 2018 : Results so far are pretty conclusive, but I wanted to take this a bit further and test 2 extremes The King of Bull Markets (Jan-Dec 2017) where B&H should be as strong as ever with very few chances to beat it. The Market of Sadness and Despair (Jan-Dec 2018) where not being in the market was the best thing to do. Results Jan-Dec 2017 Let’s start with King of Bull. I expect B&H to shine here and outperform most of the strategies … … and it does. Best strategies are close (2000% B&H vs ~1500%), but most are significantly below. Outperforming such diagonal/parabolic market is difficult, especially with basic strategies. Sometimes it’s best just to sit back, relax and enjoy that gift. Just remember that every bull market ends, and the end might be very sharp and painful, especially in Crypto. Well here you go — B&H dominates here. Results Jan-Dec 2018 This is where anything should be better than B&H. Most coins are down more than 90%. And it turns out as expected. But sadly none are profitable. Best are close to 0% returns. B&H down 80% on average, almost all strategies are doing significantly better. Max Drawdown Let’s take a look at drawdown for these strategies. No sane person would trade anything that has even close to 50% expected drawdown in just a few years of backtests. Plus in reality, it’s usually considerably worse than in tests. These strategies could (and should) be improved with some regime detection and filters. But that’s for another story. It’s unacceptable. 70–80%. Trades per Week Here’s a quick look at trade frequency (vs returns). Average is somewhere around 1 trade per week, with range being 0.5–2 trades per week. Pretty low frequency. Not that it’s bad, but could be boring for some. Of course, don’t take away from this that single MA cross strategies trade more often than MA Crossover. This isn’t absolute, trade frequency can be easily increased/reduced by changing period values. This correlates nicely with what I’ve said multiple times before in my previous posts — . It could result in more overfitting also, but that’s another story. when talking about simple long term trend following strategies, lower trade frequency usually results in more returns Extra results to the max After writing all this I realized — some might say that 3.5 years is nothing, B&H only outperforms when looking at decades of data. Well, I can’t really offer you that, but I can take max amount of data that I have: starting from Nov 2013 BTC starting from Aug 2015 ETH For other coins, I don’t have much earlier than already tested 2017. Overall, the sample size is too small (2 coins), so I probably wouldn’t draw too much conclusions from this. Also, not sure there is much point in testing such once in a lifetime 1000x market, but ok, here it goes: 10 strategies are worse than B&H. The rest (31) beat it and most by a significant margin. Interestingly, returns are close to B&H, but on strategies outperform B&H by a huge margin. BTC ETH Other than that, I’ll leave this up to you to analyze. Why these types of strategies (low freq trend following) are hard to trade I’ll skip the point that so many people don’t even know what the backtesting is and are running strategies that should be avoided if only the trader would’ve run few tests that would clearly show that strategy is a long term loser. Logical question is — why isn’t everyone doing this? Other than that, there are several serious problems. Most of them boil down to . psychological factors — these strategies are hard to endure , that might be psychologically hard to endure. Some of that could be avoided by smarter regime filters and better selection of coins. Long (months) drawdowns Often times you … that’s just the nature of basic/naive trend following strategies, especially in Crypto. Makes you feel bad. Again — this could be solved with some filters. buy top, sell bottom for a quick 10–20% loss . Trading low frequency strategies are kinda boring. A lot of traders are here not (only) for results/profits, but for action and excitement. Not much action Because of the low trade frequency, you can sometimes see the trade incoming (MAs going to cross) a good while before it happens. And sometimes you will not want the strategy to make that trade. It will look like the wrong trade. I’ve been running strategies like these live as part of my portfolio for some time now, and the . But, trades like these are part of the trend following and part of the game. Without those “wrong trades” (in hindsight), you wouldn’t catch those nice big waves. temptation to intervene and change a parameter or skip the trade is big Problems with B&H I think B&H has several problems that are based on some wrong assumptions Hodlers have: When holding, most people somehow assume that they will get in very very low and then just ride the wave to the moon, while in reality chances are you’d get in somewhere sub-optimal (like mid-2018). Yes, you can counter this with DCA, but that’s for another story. Here’s a good real-life example of what an actual HODL portfolio might look like — “ ”. I bought $1k of the Top Ten Cryptos on January 1st, 2018. Result? Down -81% Hodlers assume that eventually everything will always go up to new All-Time Highs and then they finally will be profitable if only they hold long and hard enough. That might be true for indexes (like ), but not so much for individual assets. Just check some of the TOP coins from the start of 2018, like , , . Where are they now? How are they performing compared to new top coins? How sure are you that they ever go back to highs we saw at the end of 2017? What if instead, the money will flow to new hype coins like , , or any of the DeFi ones? S&P500 XRP EOS TRX LINK XTZ ADA, Also, all of the trend following problems I mentioned in the previous section (boring, no action, drawdowns) are significantly worse with B&H. Conclusion But, I’ll be honest, the trade frequency of tested strategies is a bit on the low side and makes me suspicious about how well this would perform out of the sample. Nevertheless, strategies and parameters were chosen reasonably and with minimal hindsight, which makes me hopeful. So, to answer my initial thesis — Is B&H the best? Based on what I’ve seen running my tests and what I’ve shown in my charts, the answer is a decisive no. Statistically, over time, chances are you will outperform B&H in Crypto with basic low frequency trend following strategies. Why? My best guess is that market isn’t as effective yet and so far has shown very trendy behavior, either up or down, which suits trend following strategies very well. At one point, this will end, and then answer to my initial thesis might change. I’m trying to show you that instead of wearing the HODL badge of honor if you care about results, there are other very simple alternatives. People hear phrases like “ ” and automatically assume that all trading is bad and markets can not be outperformed. Well, that might be more true for more mature and effective markets but doesn’t look like it’s the case yet in Crypto. 95% of traders lose money Have some statistical evidence to guide your trading decisions. So the odds are ever in your favor. Bottom line and my biggest suggestion to you is — before taking any of the mantras for granted, do some basic testing and idea validation and come up with your own conclusions. Best of Luck! Previously published at https://medium.com/@deandree/is-buy-and-hold-really-the-best-strategy-in-crypto-4ae0e8c77734