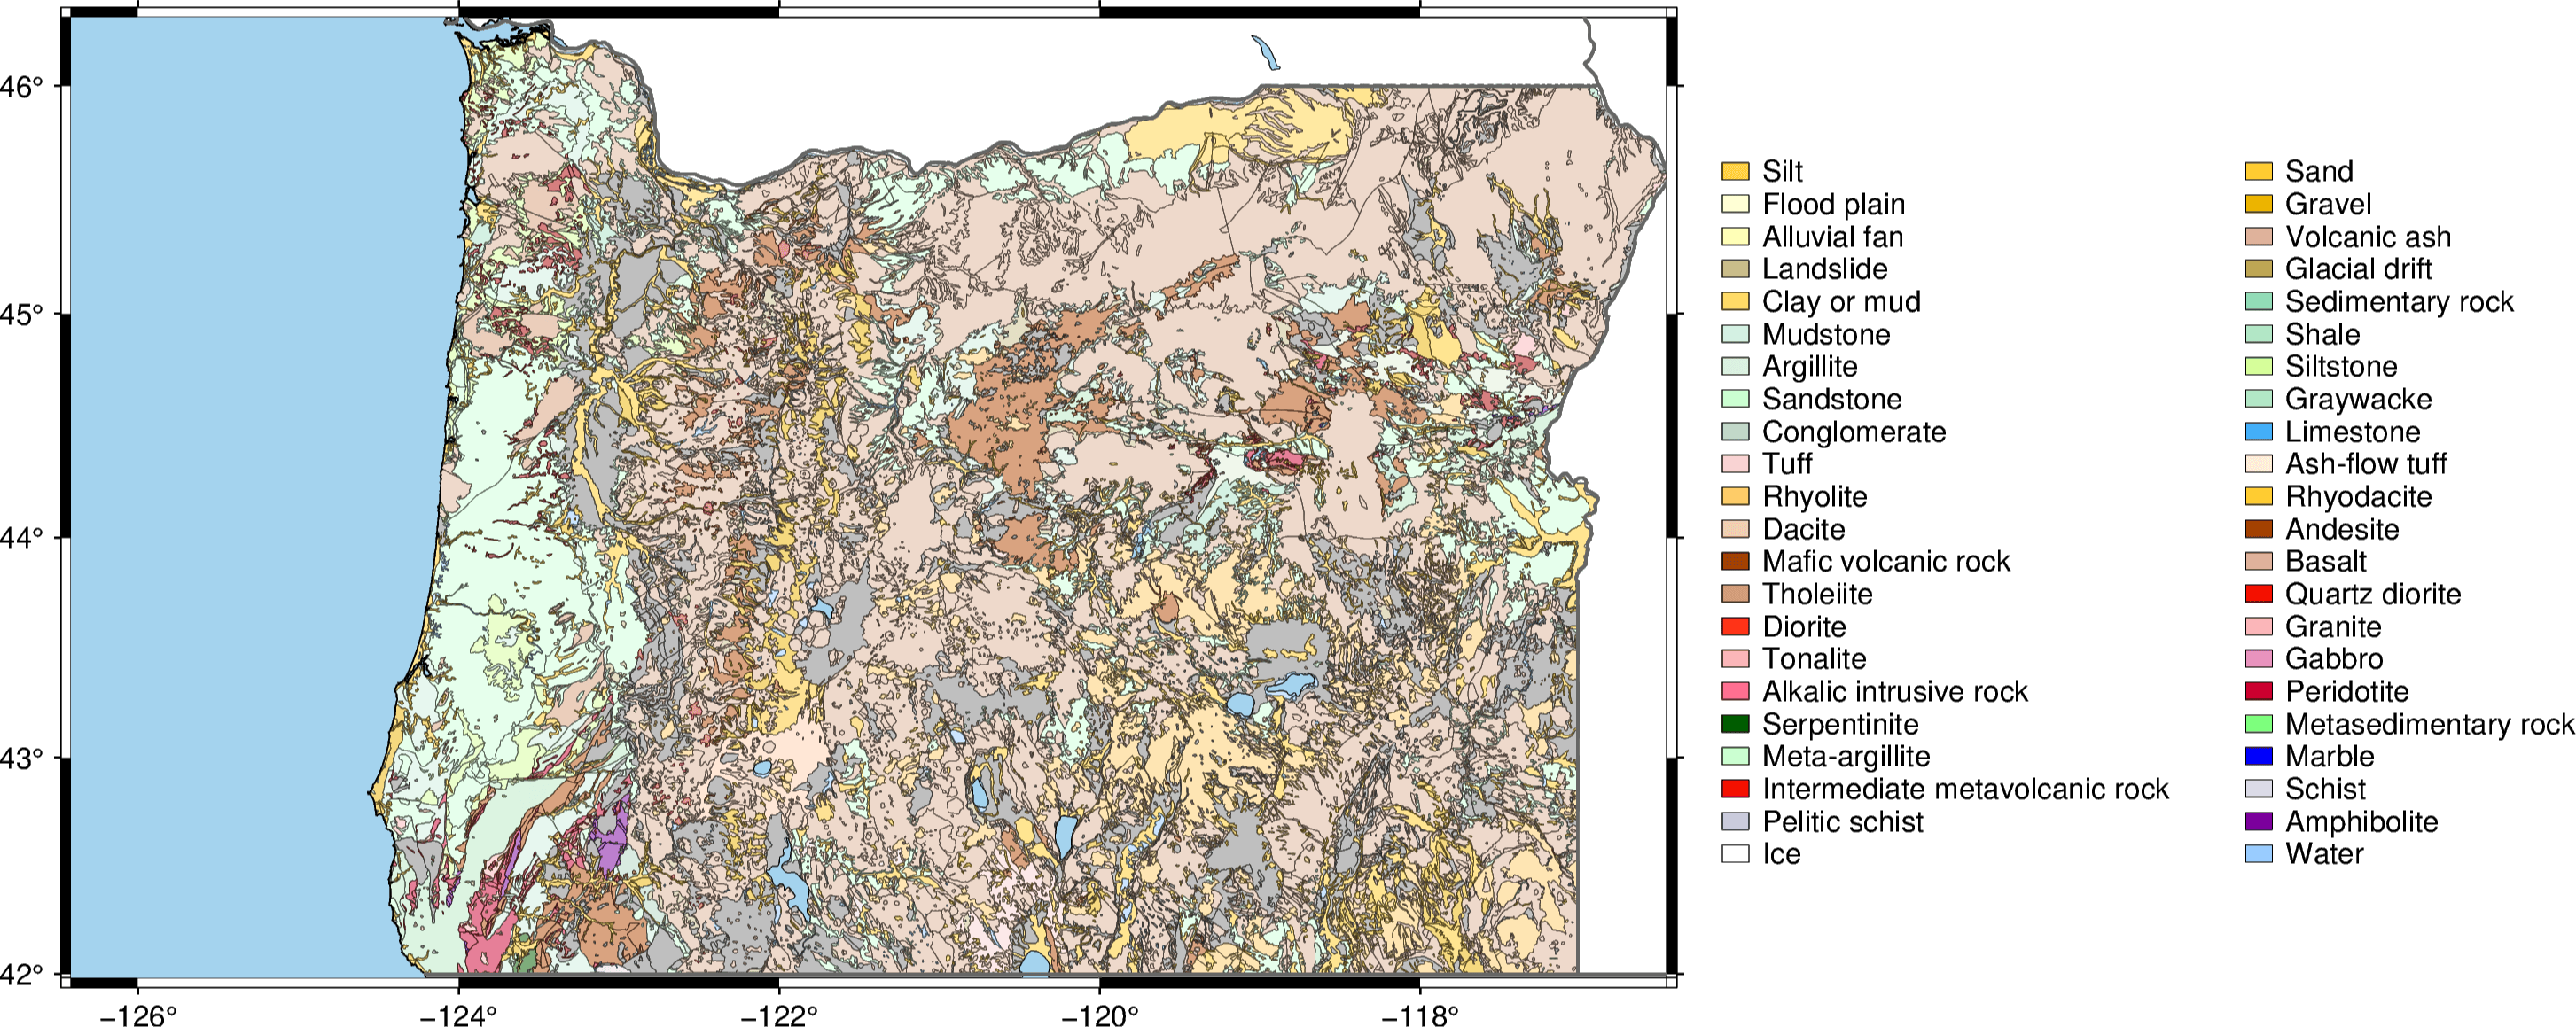
Python has some really cool geospatial libraries out there but one of the newest is PyGMT, a powerful wrapper for the storied Generic Mapping Tools. On my continuing journey to learn PyGMT, I found myself needing to plot a geologic map. After much trial and error, I was able to get it working with help from the PyGMT community. Let’s walk through one of the ways to recreate a geologic map in PyGMT v0.4.1 on Windows using the shapefile of a preexisting one: This demo will use the following files available on the : USGS website Zipped folder of the Oregon geologic map shapefiles (after following link, right-click and "Save Page As") Color info file for the geologic units While following this demo, please be aware that all code blocks are intended to be run as part of the complete code. The complete code is provided at the bottom of this page. Setting Up The Folders To follow this demo as written, you will need to edit the script to change the variable to reflect your folder name. Once you have done so, you will need to create some folders in that directory, specifically the folder, and within it , , and folders; within the folder create a folder. You can create them manually or run the demo script from anywhere which will create them for you if they don't already exist. Once you have created the folders, copy the unzipped folder of shapefiles ( ) and the color info file ( ) to the Data folder. main_dir User Oregon_Geologic_Map_Demo Methods Data Results Data Conditioned_SHP ORgeol_dd lithrgb.txt An example of the desired directory tree is as follows: # Creates the project folders def Create_Folders(self): import os # Main directory path self.main_dir = r'C:\Users\USER\Desktop\Oregon_Geologic_Map_Demo' # Path to the directory holding the project data files data_folder = os.path.join(self.main_dir, 'Data') # Path to the directory holding the project Python scripts methods_folder = os.path.join(self.main_dir, 'Methods') # Path to the directory holding the map generated by the scripts results_folder = os.path.join(self.main_dir, 'Results') # Path to the directory holding the conditioned shapefile data conditioned_shapefiles_folder = os.path.join(self.main_dir, 'Data', 'Conditioned_SHP') directories = [self.main_dir, data_folder, methods_folder, results_folder, conditioned_shapefiles_folder] # Iterates through the list of directories and creates them if they don't already exist for directory in directories: os.makedirs(directory, exist_ok = True) exit() Data files created by the demo script will save to the folder, and the geologic map of Oregon will save to the folder. The folder should contain the demo script. Data Results Methods Conditioning The Shapefile The shapefile (.shp extention) needs to be conditioned in preparation for making the color palette table (.cpt extension). The color palette table needs the geologic units names to be in a format it can understand, which necessitates no spaces or special characters. The shapefile and color palette table need to have the same names for geologic units or else coloring the geologic units won’t work, and because the color palette table is the limiting factor, we need to condition the shapefile so that the unit names will be in agreement. For simplicity’s sake, I am following the instructions provided by the USGS for coloring the geologic map using it’s ArcMap style sheet, which indicate coloring the units by the ROCKTYPE1 column. The next step is to isolate the ROCKTYPE1 column values within the shapefile and condition them: # List that holds the inital unit names unit_names_list = [] # Conditions the shapefile def Condition_Shapefile(self): import os import geopandas as gpd import pandas as pd import numpy as np # Shapefile of geologic unit polygons geo_polygons = os.path.join(self.main_dir, 'Data', 'ORgeol_dd', 'orgeol_poly_dd.shp') # Reads the shapefile into a DataFrame df_geo_polygons = gpd.read_file(geo_polygons, driver = 'SHP') # Creates a numpy array of the unique values in the ROCKTYPE1 column unit_names = df_geo_polygons['ROCKTYPE1'].unique() # List of unit names as they initally appear in the shapefile self.unit_names_list = list(unit_names) # Copy of unit names that is to be conditioned and subsituted for the original names conditioned_unit_names = list(unit_names) # Index of each character as they are read index = -1 # Keys are what need to be replaced in words, and values are what they will be replaced with replacements = {' ':'_', '/':'_', '-':'_', '(':'_', ')':'_', 'é':'e', 'mã©lange':'melange'} # Iterates through the list of unique geologic unit names from the ROCKTYPE1 column and conditions them to the desired format for name in conditioned_unit_names: index += 1 for old_value, new_value in replacements.items(): if old_value in name: conditioned_unit_names[index] = name.lower().replace(old_value, new_value) # Replaces the geologic unit names of the ROCKTYPE1 column in the dataframe with the conditioned names for name, conditioned_name in zip(unit_names, conditioned_unit_names): df_geo_polygons['ROCKTYPE1'] = df_geo_polygons['ROCKTYPE1'].replace(name, conditioned_name) # Save name for the conditioned shapefile geo_polygons_conditioned = os.path.join(self.main_dir,'Data', 'Conditioned_SHP', 'OR_geology_polygons_CONDITIONED.shp') # Saves the DataFrame as an ESRI shapefile df_geo_polygons.to_file(geo_polygons_conditioned, driver = 'ESRI Shapefile') Creating The Color Palette Table Now that the shapefile with the polygon data is conditioned, a color palette table needs to be made in order to color the polygons. The color info file that is provided as a tab-delineated text file is almost usable as color palette table, but needs some adjustments. The "code" column needs to be removed, as do the headers, and the geologic unit name column needs to come before the RGB data. Additionally, the geologic unit names need to be conditioned in the same manner as was done for the shapefile and the RGB values need to be separated with a forward slash: # Dictionary that holds the unit names from the cpt-like file prior to conditioning and the conditioned rgb colors cpt_data_dictionary = {} # Creates a color palette table file def Create_Color_Palette_Table(self): import os import pandas as pd import re # Path to table of geologic unit colors geo_colors = os.path.join(self.main_dir, 'Data', 'lithrgb.txt') # Reads the table to a DataFrame, ignoring the "code" column and skipping the column names df_geo_colors = pd.read_csv(geo_colors, sep ='\t', usecols = [1,2,3,4], skiprows = 1, header = None) # Moves the geologic unit names column to be first df_geo_colors.set_index(df_geo_colors.columns[-1], inplace = True) # Resets the index so that the new column order is respected df_geo_colors.reset_index(inplace = True) # Save name for the new cpt geo_cpt = os.path.join(self.main_dir, 'Data', 'geology_color_palette.cpt') # Writes the DataFrame as a CSV file so that the data can be conditioned df_geo_colors.to_csv(geo_cpt, sep = '\t', header = None, index = False) with open(geo_cpt, 'r', encoding = 'latin-1') as f: data = f.read() # Keys are what need to be replaced in words, and values are what they will be replaced with replacements = {' ':'', '/':'_', '-':'_', '(':'_', ')':'_', 'é':'e', 'mã©lange':'melange'} # Iterates over the replacments dictionary and replaces the desired characters in the text for old_value, new_value in replacements.items(): data = data.replace(old_value, new_value) # Converts the text to lowercase data = data.lower() # Regular expression that finds tab-spaces between numbers pattern = re.compile(r'(?<=\d)(\t)(?=\d)') # Uses the regular expression to replace tab-spaces with "/" data = pattern.sub('/', data) with open(geo_cpt, 'w') as f: f.write(data) # DataFrame used to hold the unit names from the cpt-like file prior to conditioning and the conditioned rgb colors self.df_cpt_data = pd.DataFrame() # Adds only the first column (unit name column) to a column in the new dataframe titled 'geo_unit' self.df_cpt_data['geo_unit'] = df_geo_colors.iloc[:, 0] # Reads in the conditioned cpt file using tab delimiters and no column titles df_cpt_data = pd.read_csv(geo_cpt, sep ='\t', header = None, encoding = 'latin-1') # Adds only the second column (unit color column) to a column in the new dataframe titled 'color' self.df_cpt_data['color'] = df_cpt_data.iloc[:, 1] # Converts the values of the 'geo_unit' and 'color' columns into a dictionary with 'geo_unit' as the key and 'color' as the value self.cpt_data_dictionary = pd.Series(self.df_cpt_data.color.values, index=self.df_cpt_data.geo_unit).to_dict() Creating The Postscript Legend File In order to give context to the colors of the geologic map, a legend needs to be created; this will be accomplished by creating a postscript file: # Creates a legend postscript file def Create_Legend(self): import os import pandas as pd # File path to the geologic unit legend postscript file geo_legend = os.path.join(self.main_dir, 'Data', 'geologic_unit_legend.txt') # Index counter for determining position in unit_names_list index = -1 # Iterates through the list of unit names and capitalizes the first letter of each entry for name in self.unit_names_list: index += 1 self.unit_names_list[index] = name.capitalize() # Lists of the unit names and colors to be included in the legend selected_unit_names = [] selected_colors = [] # Iterates through the dictionary of unit names and colors, capitalizes the first letter of each unit name, and then matches it with the list of inital unit names. # Then those unit names and colors are added to respective lists for name, color in self.cpt_data_dictionary.items(): cap_name = name.capitalize() if cap_name in self.unit_names_list: selected_unit_names.append(cap_name) selected_colors.append(color) # Creates a postscript file and writes some explainer text and the column format with open(geo_legend, 'w') as f: f.write( '# G is vertical gap, V is vertical line, N sets # of columns,\n' '# D draws horizontal line, H is header, L is column header,\n' '# S is symbol,\n' '# format of: symbol position, symbol type,\n' '# format of: symbol size, symbol color, symbol border thickness, text position, text\n' 'N 2\n' ) # Iterates through the unit names and colors, and adds the symbol+text lines to the existing postscript file with open(geo_legend, 'a') as f: for color, name in zip(selected_colors, selected_unit_names): f.write( 'S 0.1i r 0.1i {} 0.1p 0.20i {}\n' '\n' .format(color, name) ) Plotting The Geologic Map Now the geologic map is finally ready to be plotted: # Plots the map def Plot_Map(self): import os import geopandas as gpd import pandas as pd import pygmt # Map save name save_name = os.path.join(self.main_dir, 'Results', 'Oregon_Geologic_Map_Demo.png') # Geologic unit polygons geo_unit_data = os.path.join(self.main_dir, 'Data', 'Conditioned_SHP', 'OR_geology_polygons_CONDITIONED.shp') # Geologic unit color palette geo_unit_color = os.path.join(self.main_dir, 'Data', 'geology_color_palette.cpt') geo_unit_legend = os.path.join(self.main_dir, 'Data', 'geologic_unit_legend.txt') # Extent defining the area of interest (Oregon) <min lon><max lon><min<lat><max lat> region = [-126.418246, -116.462397, 41.984295, 46.297196] # Map projection (Mercator): <type><size><units> projection = 'M6i' # Frame annotations: [<frame sides with/without ticks>, <x-axis tick rate>, <y-axis tick rate>] frame = ['SWne', 'xa', 'ya'] # Polygon outline pens: <size><color> pens = {'geology':'0.1p,black'} # Transparency of layer, transparency of save file background transparency = {'geology':50, 'save_file':False} df_geo_polygons = gpd.read_file(geo_unit_data, driver = 'SHP') # Establishes figure to hold map layers fig = pygmt.Figure() # Forces ticks to display as degree decimal pygmt.config(FORMAT_GEO_MAP = 'D') # Forces the map frame annotation to be smaller pygmt.config(FONT_ANNOT_PRIMARY = '8p,Helvetica,black') # Basemap layer fig.basemap( region = region, projection = projection, frame = frame ) # Geologic unit layer fig.plot( # File data - automatically detects polygon coordinates if in last column data = df_geo_polygons, # Sets polygon outline colour pen = pens['geology'], # Sets polygon color map cmap = geo_unit_color, # Sets color to vary with selected column color = '+z', # Force close polygons close = True, # Sets the column used to map polygon colors (in this case colors polygons by name of geologic unit). Column name appears to be lowercase as a product of conditioning aspatial = 'Z=ROCKTYPE1', # Sets layer transperancy transparency = transparency['geology'], # Commandline feedback for debugging #verbose=True, ) # Plots the coastlines and political boundaries fig.coast( # Displays national boundaries (1) with 0.8 point gray40 lines, and does the same for state boundaries (2) borders = ['1/0.8p,gray40', '2/0.8p,gray40'], # Displays coast outlines in 0.3 point black lines, and lakeshore outlines in .1 point black lines shorelines = ['1/0.3p,black', "2/0.1p,black"], # Sets resolution full (f) [highest setting] resolution = 'f', # Sets water color water = 'lightskyblue2', ) # Plots a legend of the geologic unit names and respective colors fig.legend( spec = geo_unit_legend, # pslegend file position = 'jBL+o15.5/-4c+w10/12c', # plots text justifed bottom left (jBL) and offsets (+o) it by 15.5cm on the x-axis and -4cm on the y-axis (15.5/-4c), and establises width of columns(?)/legend area(?) (+w) as 10cm on the x-axis and 12cm on the y-axis (10/12c) ) # Saves a copy of the generated figure fig.savefig(save_name, transparent = transparency['save_file']) Result And voilà, a geologic map of Oregon is rendered with Python via PyGMT: An additional step one could take is underpinning the map with a DEM to give it more context. However, that is just slightly beyond the intended scope of this demo. I was very excited to learn how to convert publicly available geologic maps into a form I could work with in Python, and I hope this helps others looking to do the same. Complete Code ''' This script builds a geologic map of Oregon using an existing shapefile Data source website: https://mrdata.usgs.gov/geology/state/state.php?state=OR Shapefile source: http://pubs.usgs.gov/of/2005/1305/data/ORgeol_dd.zip Color info file (right-click and "save page as"): https://mrdata.usgs.gov/catalog/lithrgb.txt Setup instructions: 1) To run this script as-is, you will need to change the main_dir variable to reflect your desired path. 2) You will need to create some folders at the destination, specifically a "Oregon_Geologic_Map_Demo" folder, and within it the "Methods", "Data", and "Results" folders. You can either do that manually or run this script once from anywhere to automatically create them. 3) Once you have created them, move the unzipped shapefile folder titled ORgeol_dd to the Data folder, as well as the color info file. 4) Now, save this script to the Methods folder and run it from there, if you wish. Data files that are generated by this script will save to the Data folder, and the resulting map will save to Results ''' # Controls whether the project folders data are automatically created create_folders = False # Controls whether the shapefile data is conditioned condition_shp = True # Controls whether a color palette table is made create_cpt = True # Controls whether a geologic unit legend postscript file is created create_legend = True # Controls whether the geologic map is created plot_map = True # Class that holds all the functions pretaining to creating a geologic map of Oregon class Map_Maker(): # Main directory path main_dir = r'C:\Users\USER\Desktop\Oregon_Geologic_Map_Demo' # Creates the project folders def Create_Folders(self): import os # Path to the directory holding the project data files data_folder = os.path.join(self.main_dir, 'Data') # Path to the directory holding the project Python scripts methods_folder = os.path.join(self.main_dir, 'Methods') # Path to the directory holding the map generated by the scripts results_folder = os.path.join(self.main_dir, 'Results') # Path to the directory holding the conditioned shapefile data conditioned_shapefiles_folder = os.path.join(self.main_dir, 'Data', 'Conditioned_SHP') directories = [self.main_dir, data_folder, methods_folder, results_folder, conditioned_shapefiles_folder] # Iterates through the list of directories and creates them if they don't already exist for directory in directories: os.makedirs(directory, exist_ok = True) exit() # List that holds the inital unit names unit_names_list = [] # Conditions the shapefile def Condition_Shapefile(self): import os import geopandas as gpd import pandas as pd import numpy as np # Shapefile of geologic unit polygons geo_polygons = os.path.join(self.main_dir, 'Data', 'ORgeol_dd', 'orgeol_poly_dd.shp') # Reads the shapefile into a DataFrame df_geo_polygons = gpd.read_file(geo_polygons, driver = 'SHP') # Creates a numpy array of the unique values in the ROCKTYPE1 column unit_names = df_geo_polygons['ROCKTYPE1'].unique() # List of unit names as they initally appear in the shapefile self.unit_names_list = list(unit_names) # Copy of unit names that is to be conditioned and subsituted for the original names conditioned_unit_names = list(unit_names) # Index of each character as they are read index = -1 # Keys are what need to be replaced in words, and values are what they will be replaced with replacements = {' ':'_', '/':'_', '-':'_', '(':'_', ')':'_', 'é':'e', 'mã©lange':'melange'} # Iterates through the list of unique geologic unit names from the ROCKTYPE1 column and conditions them to the desired format for name in conditioned_unit_names: index += 1 for old_value, new_value in replacements.items(): if old_value in name: conditioned_unit_names[index] = name.lower().replace(old_value, new_value) # Replaces the geologic unit names of the ROCKTYPE1 column in the dataframe with the conditioned names for name, conditioned_name in zip(unit_names, conditioned_unit_names): df_geo_polygons['ROCKTYPE1'] = df_geo_polygons['ROCKTYPE1'].replace(name, conditioned_name) # Save name for the conditioned shapefile geo_polygons_conditioned = os.path.join(self.main_dir,'Data', 'Conditioned_SHP', 'OR_geology_polygons_CONDITIONED.shp') # Saves the DataFrame as an ESRI shapefile df_geo_polygons.to_file(geo_polygons_conditioned, driver = 'ESRI Shapefile') # Dictionary that holds the unit names from the cpt-like file prior to conditioning and the conditioned rgb colors cpt_data_dictionary = {} # Creates a color palette table file def Create_Color_Palette_Table(self): import os import pandas as pd import re # Path to table of geologic unit colors geo_colors = os.path.join(self.main_dir, 'Data', 'lithrgb.txt') # Reads the table to a DataFrame, ignoring the "code" column and skipping the column names df_geo_colors = pd.read_csv(geo_colors, sep ='\t', usecols = [1,2,3,4], skiprows = 1, header = None) # Moves the geologic unit names column to be first df_geo_colors.set_index(df_geo_colors.columns[-1], inplace = True) # Resets the index so that the new column order is respected df_geo_colors.reset_index(inplace = True) # Save name for the new cpt geo_cpt = os.path.join(self.main_dir, 'Data', 'geology_color_palette.cpt') # Writes the DataFrame as a CSV file so that the data can be conditioned df_geo_colors.to_csv(geo_cpt, sep = '\t', header = None, index = False) with open(geo_cpt, 'r', encoding = 'latin-1') as f: data = f.read() # Keys are what need to be replaced in words, and values are what they will be replaced with replacements = {' ':'', '/':'_', '-':'_', '(':'_', ')':'_', 'é':'e', 'mã©lange':'melange'} # Iterates over the replacments dictionary and replaces the desired characters in the text for old_value, new_value in replacements.items(): data = data.replace(old_value, new_value) # Converts the text to lowercase data = data.lower() # Regular expression that finds tab-spaces between numbers pattern = re.compile(r'(?<=\d)(\t)(?=\d)') # Uses the regular expression to replace tab-spaces with "/" data = pattern.sub('/', data) with open(geo_cpt, 'w') as f: f.write(data) # DataFrame used to hold the unit names from the cpt-like file prior to conditioning and the conditioned rgb colors self.df_cpt_data = pd.DataFrame() # Adds only the first column (unit name column) to a column in the new dataframe titled 'geo_unit' self.df_cpt_data['geo_unit'] = df_geo_colors.iloc[:, 0] # Reads in the conditioned cpt file using tab delimiters and no column titles df_cpt_data = pd.read_csv(geo_cpt, sep ='\t', header = None, encoding = 'latin-1') # Adds only the second column (unit color column) to a column in the new dataframe titled 'color' self.df_cpt_data['color'] = df_cpt_data.iloc[:, 1] # Converts the values of the 'geo_unit' and 'color' columns into a dictionary with 'geo_unit' as the key and 'color' as the value self.cpt_data_dictionary = pd.Series(self.df_cpt_data.color.values, index=self.df_cpt_data.geo_unit).to_dict() # Creates a legend postscript file def Create_Legend(self): import os import pandas as pd # File path to the geologic unit legend postscript file geo_legend = os.path.join(self.main_dir, 'Data', 'geologic_unit_legend.txt') # Index counter for determining position in unit_names_list index = -1 # Iterates through the list of unit names and capitalizes the first letter of each entry for name in self.unit_names_list: index += 1 self.unit_names_list[index] = name.capitalize() # Lists of the unit names and colors to be included in the legend selected_unit_names = [] selected_colors = [] # Iterates through the dictionary of unit names and colors, capitalizes the first letter of each unit name, and then matches it with the list of inital unit names. # Then those unit names and colors are added to respective lists for name, color in self.cpt_data_dictionary.items(): cap_name = name.capitalize() if cap_name in self.unit_names_list: selected_unit_names.append(cap_name) selected_colors.append(color) # Creates a postscript file and writes some explainer text and the column format with open(geo_legend, 'w') as f: f.write( '# G is vertical gap, V is vertical line, N sets # of columns,\n' '# D draws horizontal line, H is header, L is column header,\n' '# S is symbol,\n' '# format of: symbol position, symbol type,\n' '# format of: symbol size, symbol color, symbol border thickness, text position, text\n' 'N 2\n' ) # Iterates through the unit names and colors, and adds the symbol+text lines to the existing postscript file with open(geo_legend, 'a') as f: for color, name in zip(selected_colors, selected_unit_names): f.write( 'S 0.1i r 0.1i {} 0.1p 0.20i {}\n' '\n' .format(color, name) ) # Plots the map def Plot_Map(self): import os import geopandas as gpd import pandas as pd import pygmt # Map save name save_name = os.path.join(self.main_dir, 'Results', 'Oregon_Geologic_Map_Demo.png') # Geologic unit polygons geo_unit_data = os.path.join(self.main_dir, 'Data', 'Conditioned_SHP', 'OR_geology_polygons_CONDITIONED.shp') # Geologic unit color palette geo_unit_color = os.path.join(self.main_dir, 'Data', 'geology_color_palette.cpt') geo_unit_legend = os.path.join(self.main_dir, 'Data', 'geologic_unit_legend.txt') # Extent defining the area of interest (Oregon) <min lon><max lon><min<lat><max lat> region = [-126.418246, -116.462397, 41.984295, 46.297196] # Map projection (Mercator): <type><size><units> projection = 'M6i' # Frame annotations: [<frame sides with/without ticks>, <x-axis tick rate>, <y-axis tick rate>] frame = ['SWne', 'xa', 'ya'] # Polygon outline pens: <size><color> pens = {'geology':'0.1p,black'} # Transparency of layer, transparency of save file background transparency = {'geology':50, 'save_file':False} df_geo_polygons = gpd.read_file(geo_unit_data, driver = 'SHP') # Establishes figure to hold map layers fig = pygmt.Figure() # Forces ticks to display as degree decimal pygmt.config(FORMAT_GEO_MAP = 'D') # Forces the map frame annotation to be smaller pygmt.config(FONT_ANNOT_PRIMARY = '8p,Helvetica,black') # Basemap layer fig.basemap( region = region, projection = projection, frame = frame ) # Geologic unit layer fig.plot( # data file - automatically detects polygon coordinates if in last column data = df_geo_polygons, # Sets polygon outline colour pen = pens['geology'], # Sets polygon color map cmap = geo_unit_color, # Sets color to vary with selected column color = '+z', # Force close polygons close = True, # Sets the column used to map polygon colors (in this case colors polygons by name of geologic unit). Cloumn name appears to be lowercase as a product of conditioning aspatial = 'Z=ROCKTYPE1', # Sets layer transperancy transparency = transparency['geology'], # Commandline feedback for debugging #verbose=True, ) # Plots the coastlines and political boundaries fig.coast( # Displays national boundaries (1) with 0.8 point gray40 lines, and does the same for state boundaries (2) borders = ['1/0.8p,gray40', '2/0.8p,gray40'], # Displays coast outlines in 0.3 point black lines, and lakeshore outlines in .1 point black lines shorelines = ['1/0.3p,black', "2/0.1p,black"], # Sets resolution full (f) [highest setting] resolution = 'f', # Sets water color water = 'lightskyblue2', ) # Plots a legend of the geologic unit names and respective colors fig.legend( spec = geo_unit_legend, # pslegend file position = 'jBL+o15.5/-4c+w10/12c', # plots text justifed bottom left (jBL) and offsets (+o) it by 15.5cm on the x-axis and -4cm on the y-axis (15.5/-4c), and establises width of columns(?)/legend area(?) (+w) as 10cm on the x-axis and 12cm on the y-axis (10/12c) ) # Saves a copy of the generated figure fig.savefig(save_name, transparent = transparency['save_file']) data = Map_Maker() function_controls = [create_folders, condition_shp, create_cpt, create_legend, plot_map] functions = [data.Create_Folders, data.Condition_Shapefile, data.Create_Color_Palette_Table, data.Create_Legend, data.Plot_Map] for control, function in zip(function_controls, functions): if control == True: function()