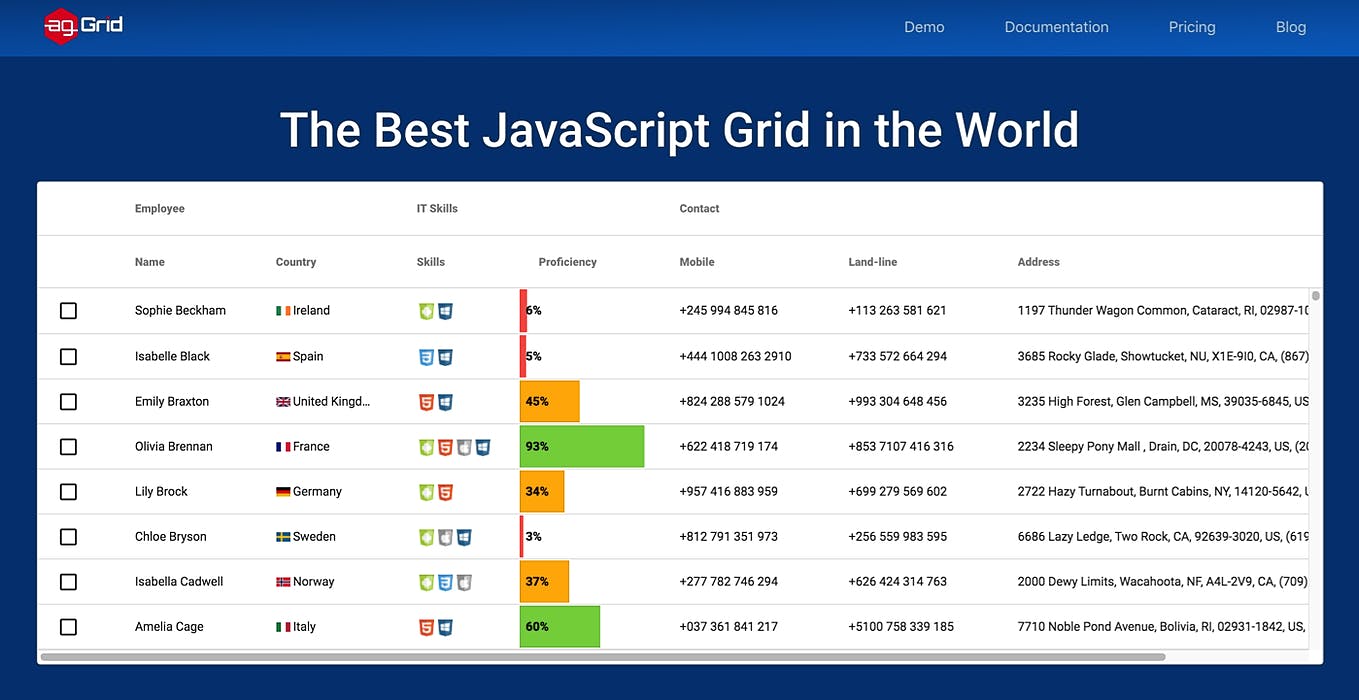
In the , I showed the ways of designing tables and gave examples of their application in practice. It was about how to make tables more beautiful and convenient by choosing the thickness of the lines, the type of frame, the background color, etc. previous article Now I want to show you how to improve the tables by designing the content and information in the cells. How to simplify the reading of data and speed up work with the table. I will take real tables with data and show how these techniques work with actual examples. If we are not talking about static tables for presentation or printing, but about dynamic ones that are generated from a database, then all these techniques will require additional time for developers and content managers. I will give the techniques in order from the simplest to the more expensive in terms of resources needed for implementation. 1. Changing the Font Color If the table has columns with dynamics indicators, for example, the percentage of change in something or gain/loss in absolute terms, then to improve perception, you can color the numbers red (decrease) and green (increase). Also, if there is a column with a lot of zero values, you can make them a lighter shade of gray and thus highlight non-zero cells. 2. Using Color to Indicate Status When there is a column with statuses in the table, their coloring in bright colors will simplify the reading of information and speed up work with data. Each status is assigned its own color, in which you can color the text, or add additional graphic elements - frame, background fill, or icon. 3. Background Fill of Cells Depending on the Value For tables of the same type of digital indicators, you can apply a differentiated background fill of all cells, depending on the value in a specific cell. The higher the value, the darker the shade, and the smaller - the lighter. In some cases, this can greatly speed up the work with data, making it understandable at a glance for an experienced user. 4. Partial Background Filling of Table Cells or Use of Variable Length Lines To quickly understand the difference in the values in the cells of one column, you can use a partial fill - fill them with a percentage of the maximum value in the column corresponding to the value in the cell. Or do the same by adding lines of variable length to the cells, also depending on the value in the cell. Thus, we will get a kind of bar chart, which will show the ratio of values in different rows. It can be applied to one or more columns in a table. 5. Using Icons to Replace Text Values In some cases, you can improve the table by replacing some of the text values with icons. You can paint them in different colors for faster reading. You can also insert icons instead of links to documents, or actions with a table. 6. Adding Companies’ Logos and Users’ Avatars If there is a column in the table, usually the first, with the names of companies, brands, or countries, you can add their logos or flags. For example, it works well in cryptocurrency tables. Also, if there is a column with the user's name, and users have avatars, you can add them to the table. This will also speed up the perception of information and the search for the desired lines. 7. Adding Graphs to Table Cells To convey the dynamics of the indicator, you can put small graphs in the cells of the table showing changes over a short period of time. This will help not only to quickly assess the dynamics of the indicator itself without going to the next page but also to compare it with the neighboring rows. 8. Converting a Table Into a Graph Finally, you can completely replace the table with a graph, and visualize all the values. Sometimes it can greatly simplify the understanding of information and speed up work. This is quite rarely applicable and requires significant resources in development, but it can bring significant results. I have where I describe a successful case of visualizing a table with a credit history, which significantly reduced the labor costs of highly paid bank credit analysts. an article Additionally, you can let the user choose in which form to view the information - add switching between the table and the graph. Thanks for your attention. In the following articles, I will tell you about the techniques for designing graphs so that they are beautiful and convenient.