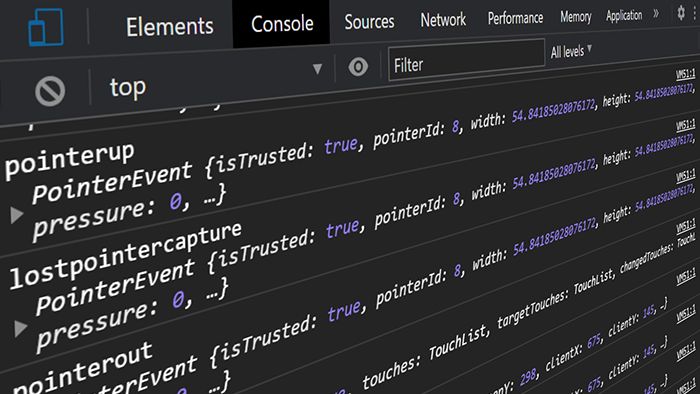
The screenshots shown are from the simulated problem section of the article, not the original code issue, due to privacy concerns. The screenshots shown are from the simulated problem section of the article, not the original code issue, due to privacy concerns. 🗂️ Table of Contents The Setup The Problem: Page Freeze on Input Failed Debug Attempts The Breakthrough: Pause Script Execution The Root Cause: A Loop That Never Ends 🧠 Simulating the Freeze (Try It Yourself) What I Learned Bonus Thought: Debugging Memory Leaks Tags The Setup The Problem: Page Freeze on Input Failed Debug Attempts The Breakthrough: Pause Script Execution The Root Cause: A Loop That Never Ends 🧠 Simulating the Freeze (Try It Yourself) What I Learned Bonus Thought: Debugging Memory Leaks Tags The Setup This bug appeared in a React + TypeScript + Redux + RxJS project. React + TypeScript + Redux + RxJS The form had a single numeric fieldquantity. When updated, it triggered a Redux selector (built using reselect) to recalculate the Total cost state synced text. quantity Redux selector reselect Total cost Everything looked fine on the Buyside. Buy But switching to the Sell side caused something bizarre: the page froze instantly when entering even 1. Sell 1 The Problem: Page Freeze on Input When typing in the quantity field: The UI froze completely The browser tab became unresponsive The CPU usage 100% in Chrome Performance Monitor. (Sometimes, the JS heap size also keeps increasing) The UI froze completely The UI froze completely The browser tab became unresponsive The browser tab became unresponsive The CPU usage 100% in Chrome Performance Monitor. (Sometimes, the JS heap size also keeps increasing) The CPU usage 100% in Chrome Performance Monitor. (Sometimes, the JS heap size also keeps increasing) CPU usage 100% This wasn’t a typical “slow” render. It was a complete hang. complete hang Chrome eventually showed the “Page Unresponsive” dialog & I had to kill the tab. Failed Debug Attempts Common debugging methods didn’t help: Attempt Result console.log Never printed anything debugger; Too slow or never triggered React DevTools Profiler Froze with the app Chrome Performance Profiler Couldn’t finish recording Removing components Still froze, even with just the input Attempt Result console.log Never printed anything debugger; Too slow or never triggered React DevTools Profiler Froze with the app Chrome Performance Profiler Couldn’t finish recording Removing components Still froze, even with just the input Attempt Result Attempt Attempt Result Result console.log Never printed anything console.log console.log console.log Never printed anything Never printed anything debugger; Too slow or never triggered debugger; debugger; debugger; Too slow or never triggered Too slow or never triggered React DevTools Profiler Froze with the app React DevTools Profiler React DevTools Profiler Froze with the app Froze with the app Chrome Performance Profiler Couldn’t finish recording Chrome Performance Profiler Chrome Performance Profiler Couldn’t finish recording Couldn’t finish recording Removing components Still froze, even with just the input Removing components Removing components Still froze, even with just the input Still froze, even with just the input The issue had to be a loop or recursive render running endlessly. But where? 🤔 loop or recursive render The Breakthrough: Pause Script Execution Then I came to a realization: if the JavaScript heap keeps growing, JavaScript is still running. JavaScript is still running So I opened Chrome DevTools → Sources taband used the hidden gem:Pause Script Execution (⏸️) Chrome DevTools → Sources tab Pause Script Execution (⏸️) Unfortunately, I could not see an explanation of this feature even in the official Chrome DevTools docs: https://developer.chrome.com/docs/devtools/javascript/breakpoint Unfortunately, I could not see an explanation of this feature even in the official Chrome DevTools docs: https://developer.chrome.com/docs/devtools/javascript/breakpoint Unfortunately, I could not see an explanation of this feature even in the official Chrome DevTools docs: https://developer.chrome.com/docs/devtools/javascript/breakpoint https://developer.chrome.com/docs/devtools/javascript/breakpoint Steps: Open Chrome DevTools first! You won’t be able to open them during the freeze. Reproduce the freeze (enter quantity). When the tab hangs, open DevTools → Sources tab. Click the ⏸️ Pause icon (top-right). Chrome freezes JS execution at that exact line. Scroll down on the right panel & check the Call Stack panel to trace which functions are currently executing. Scroll through the parent calls to reveal how the function chain started. You can even click on the parent calls to see their invoked line! Open Chrome DevTools first! You won’t be able to open them during the freeze. Open Chrome DevTools first! You won’t be able to open them during the freeze. Reproduce the freeze (enter quantity). Reproduce the freeze (enter quantity). When the tab hangs, open DevTools → Sources tab. When the tab hangs, open DevTools → Sources tab. DevTools → Sources tab Click the ⏸️ Pause icon (top-right). Click the ⏸️ Pause icon (top-right). ⏸️ Pause Chrome freezes JS execution at that exact line. Chrome freezes JS execution at that exact line. at that exact line Scroll down on the right panel & check the Call Stack panel to trace which functions are currently executing. Scroll down on the right panel & check the Call Stack panel to trace which functions are currently executing. Call Stack Scroll through the parent calls to reveal how the function chain started. You can even click on the parent calls to see their invoked line! Scroll through the parent calls to reveal how the function chain started. You can even click on the parent calls to see their invoked line! The Root Cause: A Loop That Never Ends The paused stack revealed a chain of 8+ functions, starting from the onChange handler and ending inside a utility function used by a Redux Reselect selector. onChange utility function Redux Reselect selector Here’s the culprit: let a = 0; const size = props.size; // expected number, got string while (a < size) { // do something } let a = 0; const size = props.size; // expected number, got string while (a < size) { // do something } Turns out props.size came indirectly from the input value: a string like "5". props.size string "5" Due to JS coercion quirks, the loop comparison failed to exit under certain conditions, causing an infinite loop and freezing the entire thread. Fixing it was as simple as converting the value to a number before use: const size = Number(props.size); const size = Number(props.size); Instantly, the page freeze disappeared 🎉. 🧠 Simulating the Freeze (Try It Yourself) You can recreate this exact bug and try the debugging trick yourself by going to this codesandbox link OR running the below code in a new Create React App, but save your work first because this will hang your browser tab 😅 link link Create React App, will import { useState } from "react"; export default function App() { const [quantity, setQuantity] = useState(""); const handleChange = (e) => { const value = e.target.value; setQuantity(value); const end = Date.now() + 145000; let a = 0; // ❌ Intentional infinite loop while (Date.now() < end) { // Busy-wait a++; } console.log("Done!"); // never reached }; return ( <div style={{ padding: 20 }}> <h2>🧊 Simulate a Page Freeze</h2> <input type="text" placeholder="Enter quantity" value={quantity} onChange={handleChange} /> <p>Type any number and watch Chrome suffer.</p> </div> ); } import { useState } from "react"; export default function App() { const [quantity, setQuantity] = useState(""); const handleChange = (e) => { const value = e.target.value; setQuantity(value); const end = Date.now() + 145000; let a = 0; // ❌ Intentional infinite loop while (Date.now() < end) { // Busy-wait a++; } console.log("Done!"); // never reached }; return ( <div style={{ padding: 20 }}> <h2>🧊 Simulate a Page Freeze</h2> <input type="text" placeholder="Enter quantity" value={quantity} onChange={handleChange} /> <p>Type any number and watch Chrome suffer.</p> </div> ); } Steps to Reproduce Open this code in the above codesandbox or locally. Type any number in the input. Watch the tab freeze solid. Open Chrome DevTools → Sources tab → ⏸️ Pause script execution. Observe the infinite loop inside handleChange in the call stack. Open this code in the above codesandbox or locally. Type any number in the input. Watch the tab freeze solid. Open Chrome DevTools → Sources tab → ⏸️ Pause script execution. Chrome DevTools → Sources tab → ⏸️ Pause script execution Observe the infinite loop inside handleChange in the call stack. handleChange What I Learned When nothing works: pause script execution is the silver bullet. Infinite loops can hide inside selectors, reducers, or utility files far from the UI. Always sanitize and type-check user input before computations. while loops are sharp tools: one wrong condition and your app becomes a CPU toaster 🤐. When nothing works: pause script execution is the silver bullet. pause script execution Infinite loops can hide inside selectors, reducers, or utility files far from the UI. Always sanitize and type-check user input before computations. while loops are sharp tools: one wrong condition and your app becomes a CPU toaster 🤐. while Bonus Thought: Debugging Memory Leaks This same technique could help track slow memory leaks→ cases where the JS heap increases gradually. memory leaks Pausing script execution during idle time might reveal which background processes or subscriptions are still running unnecessarily. But that’s an experiment for another article 😉.