Modern software programming languages, compilers, and frameworks abstract away underlying complexities and details, allowing developers to focus on building systems and applications to solve business problems. This design enables engineers to specialize and build expertise in specific layers, pushing boundaries. However, when tasked with solving problems that stretch hardware capabilities to the maximum and the hardware is operating at its peak, understanding the underlying architecture and complexities becomes crucial. Novel software paradigms that dramatically increase system performance with real-world implications arise from such scenarios.
In this post, we’ll explore the Locality of Reference principle & see how having mechanical sympathy makes us better engineers. To
Locality Of Reference (LOR) is a principle in computer architecture that refers to the tendency of programs to access data and instructions that are close to each other in memory. As we saw in a previous blog
Temporal Locality — Tendency of programs to access the same memory location repeatedly for a short time. E.g., a+=10 -> Reading the value of a and saving the result back to a. It is beneficial to keep close to the processor to avoid costly (slow) access to main memory.
Spatial Locality — Tendency of programs to access memory locations to nearby data that is currently being accessed. Eg: we have two variables a and b declared in program and they will be close together in main memory page when program is loaded in memory. So, during the fetch cycle, when a is being read from the main memory (cache line), b will likely also be in the same cache line and will be available in the cache.
Sequential Locality — Tendency of programs to access memory locations sequentially. E.g., array elements will be stored sequentially in memory. When the program is iterating over an array, when the first element is being read, the next contiguous elements will also be read (as part of the cache line) from the main memory and be available in the cache.
Instruction Locality — Similar to the above data LOR types, instructions are also prefetched and made available in caches.
So, if data load happens for a single element in a cache line, all elements in a cache line are loaded, resulting in quicker access to subsequent elements.
Matrix multiplication is a classic example with which we can quickly see the impact of the LOR principle. Here is a simple program that does MatMul without any libraries in Python.
import sys, random
from tqdm import tqdm
from time import *
n = 500
A = [[random.random()
for row in range(n)]
for col in range(n)]
B = [[random.random()
for row in range(n)]
for col in range(n)]
C = [[0 for row in range(n)]
for col in range(n)]
print("calculating ... \n")
start = time()
# inefficient
for i in tqdm(range(n)):
for j in range(n):
for k in range(n):
C[i][j] += A[i][k] * B[k][j]
# efficient
#for i in tqdm(range(n)):
# for k in range(n):
# for j in range(n):
# C[i][j] += A[i][k] * B[k][j]
end = time()
print("%0.6f"%(end-start))
The above Python program can be further sped up in several ways (changing programming language, compiler optimizations, parallel calculation, tiling, vectorization, AVX, CUDA, etc.,) which are not in the scope of this post. If interested in those, refer to:
MIT OpenCourseWare — Performance Engineering —
Running the inefficient & efficient versions of the above program in my Ubuntu workstation & benchmarking using cachegrind gives:
$ valgrind --tool=cachegrind python matmul_inefficient.py
==253768== Cachegrind, a cache and branch-prediction profiler
==253768== Copyright (C) 2002-2017, and GNU GPL'd, by Nicholas Nethercote et al.
==253768== Using Valgrind-3.18.1 and LibVEX; rerun with -h for copyright info
==253768== Command: python matmul_inefficient.py
==253768==
--253768-- warning: L3 cache found, using its data for the LL simulation.
calculating ...
100%|███████████████████████████████████████████████████████████████████████████████████████████████████████████████████████████████████████████████████████████████████████████████████████████████████████████████████████████████████████████████████████████████████████████████████████████████████████████████████████████████████████████████████| 500/500 [14:33<00:00, 1.75s/it]
873.798730
==253768==
==253768== I refs: 314,734,342,652
==253768== I1 misses: 5,738,193
==253768== LLi misses: 870,629
==253768== I1 miss rate: 0.00%
==253768== LLi miss rate: 0.00%
==253768==
==253768== D refs: 150,606,141,341 (105,453,303,262 rd + 45,152,838,079 wr)
==253768== D1 misses: 622,837,260 ( 616,546,831 rd + 6,290,429 wr)
==253768== LLd misses: 2,065,607 ( 1,493,478 rd + 572,129 wr)
==253768== D1 miss rate: 0.4% ( 0.6% + 0.0% )
==253768== LLd miss rate: 0.0% ( 0.0% + 0.0% )
==253768==
==253768== LL refs: 628,575,453 ( 622,285,024 rd + 6,290,429 wr)
==253768== LL misses: 2,936,236 ( 2,364,107 rd + 572,129 wr)
==253768== LL miss rate: 0.0% ( 0.0% + 0.0% )
$ valgrind --tool=cachegrind python matmul_efficient.py
==296074== Cachegrind, a cache and branch-prediction profiler
==296074== Copyright (C) 2002-2017, and GNU GPL'd, by Nicholas Nethercote et al.
==296074== Using Valgrind-3.18.1 and LibVEX; rerun with -h for copyright info
==296074== Command: python matmul_efficient.py
==296074==
--296074-- warning: L3 cache found, using its data for the LL simulation.
calculating ...
100%|███████████████████████████████████████████████████████████████████████████████████████████████████████████████████████████████████████████████████████████████████████████████████████████████████████████████████████████████████████████████████████████████████████████████████████████████████████████████████████████████████████████████████| 500/500 [14:31<00:00, 1.74s/it]
871.885507
==296074==
==296074== I refs: 318,987,466,754
==296074== I1 misses: 4,224,884
==296074== LLi misses: 832,073
==296074== I1 miss rate: 0.00%
==296074== LLi miss rate: 0.00%
==296074==
==296074== D refs: 151,347,143,927 (106,200,231,179 rd + 45,146,912,748 wr)
==296074== D1 misses: 218,499,487 ( 216,816,521 rd + 1,682,966 wr)
==296074== LLd misses: 2,111,315 ( 1,539,359 rd + 571,956 wr)
==296074== D1 miss rate: 0.1% ( 0.2% + 0.0% )
==296074== LLd miss rate: 0.0% ( 0.0% + 0.0% )
==296074==
==296074== LL refs: 222,724,371 ( 221,041,405 rd + 1,682,966 wr)
==296074== LL misses: 2,943,388 ( 2,371,432 rd + 571,956 wr)
==296074== LL miss rate: 0.0% ( 0.0% + 0.0% )
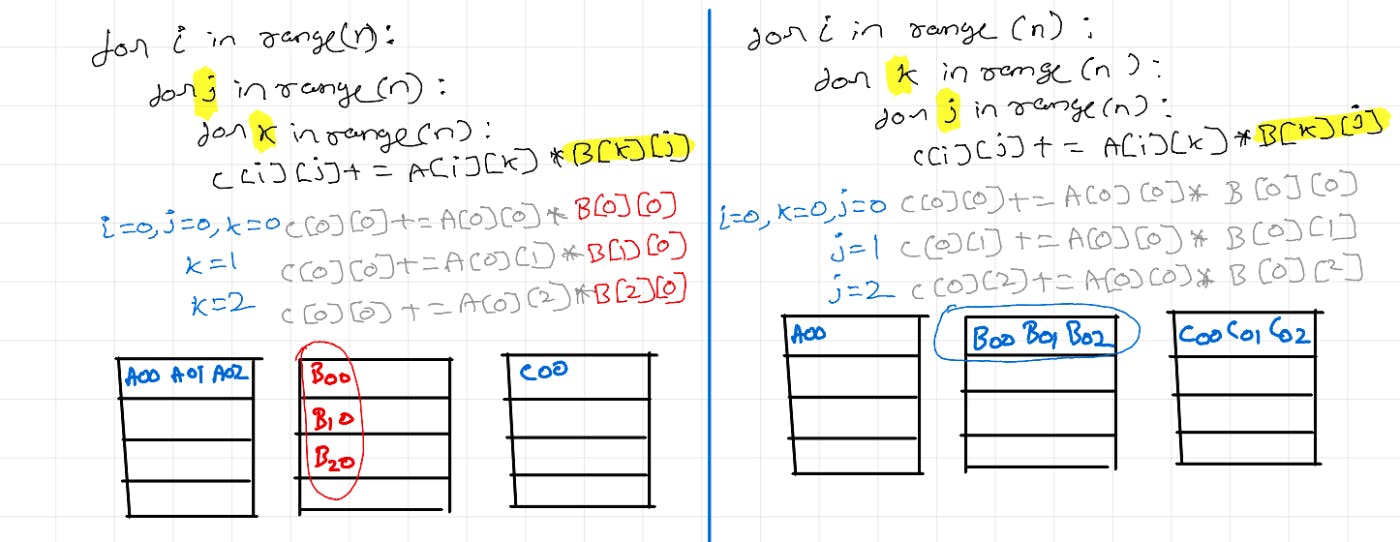
My workstation is a powerful machine, and 500x500 is a small matrix. So treat L3 cache as main memory and L1 cache as cache memory. The D1 miss rate of the inefficient version is 0.4%, and for the efficient version, it is 0.1%, resulting in runtime improvement of ~2s. Let's apply sequential locality to a small matrix (for the purpose of visualization) and see how changing loop order is giving this performance gain.
As seen above, the memory access pattern for matrix B is inefficient on the left. Just by changing the iteration order, the access pattern for matrix B is fixed, and we get a free performance boost. Thus, having mechanical sympathy for the underlying hardware architecture helps in improving matmul performance.
As seen above, the memory access pattern for matrix B is inefficient on the left. Just by changing the iteration order, the access pattern for matrix B is fixed, and we get a free performance boost. Thus, having mechanical sympathy for the underlying hardware architecture helps in improving MatMul performance.
Implementing MatMul of 4096x4096 in C and changing loop order provides a
This is a part of a
Read my other posts —
References: