
9,665 reads
What Is Data Visualization? Definition, History, and Examples


Too Long; Didn't Read
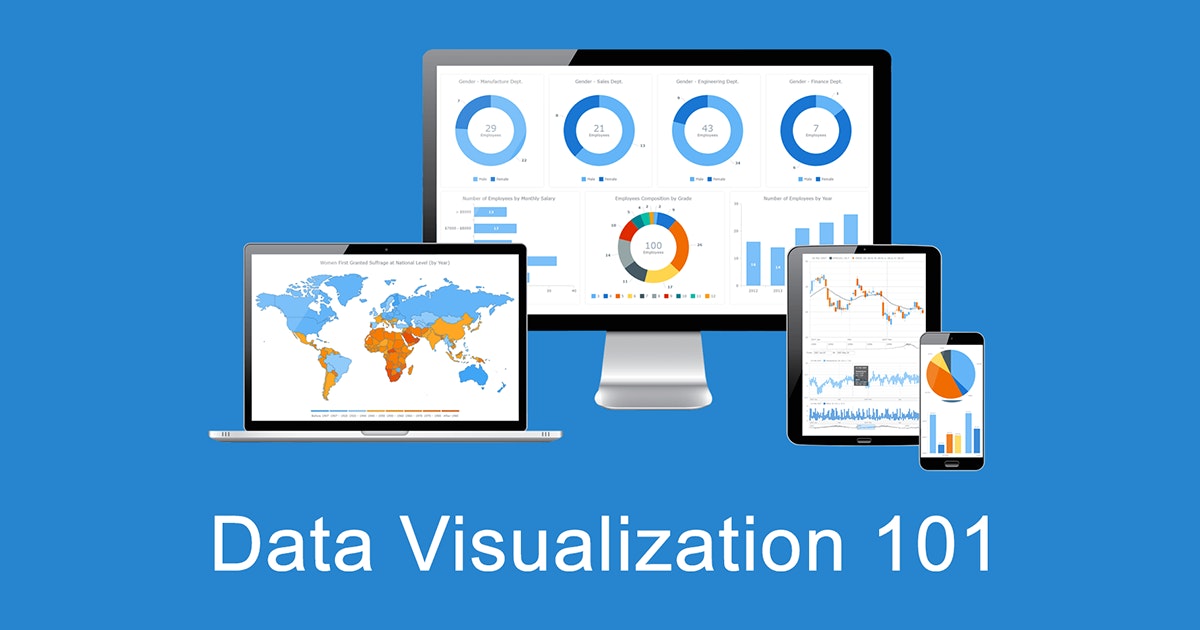
<strong>Data visualization</strong> is the practice of converting data from raw figures into a graphical representation such as graphs, maps, charts, and complex dashboards. Let’s see what makes it important (meaning), how it has developed (history), and exactly how it can work in real life (examples). Join us on Data Visualization 101, an introduction to dataviz and its power.Companies Mentioned

Coin Mentioned


AnyChart
@AnyChart

L O A D I N G
. . . comments & more!
. . . comments & more!