
196 reads
Visualization of Hypothesis on Meteorological data


Too Long; Didn't Read
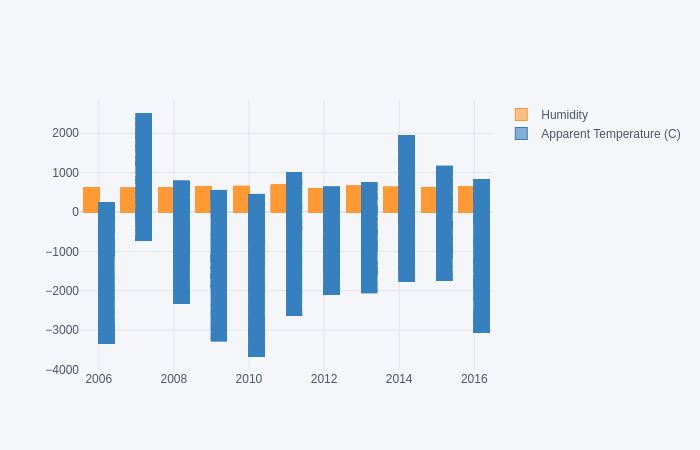
The Null Hypothesis H0 is "Has the Apparent temperature and humidity compared monthly across 10 years of the data indicate an increase due to Global warming". The H0 means we need to find whether the average temperature for the month of a month says April starting from 2006 to 2016 and the average humidity for the same period has increased or not. This monthly analysis has to be done for all 12 months over the 10 year period. We are gonna perform the analysis on the Meteorological data and prove the hypothesis based on visualization.Company Mentioned


KAVISH GOYAL
@kavish
Self Taught Machine Learning Engineer and Data Scientist.Love Data driven problem and AI,ML and DS.
About @kavish
LEARN MORE ABOUT @KAVISH'S
EXPERTISE AND PLACE ON THE INTERNET.
EXPERTISE AND PLACE ON THE INTERNET.

L O A D I N G
. . . comments & more!
. . . comments & more!