paint-brush
Quantifying Preference Manipulation: Growth Trends in Amazon's Barrier-to-Exit Over Timeby@escholar
109 reads

Quantifying Preference Manipulation: Growth Trends in Amazon's Barrier-to-Exit Over Time

tldt arrow

Too Long; Didn't Read

The analysis shows a 1.8% annual growth in Barrier-to-Exit, indicating a significant trend in preference manipulation within Amazon's recommender system. Visualizations illustrate a 43% growth in Barrier-to-Exit over the study period, highlighting shifting user behaviors and preferences.
featured image - Quantifying Preference Manipulation: Growth Trends in Amazon's Barrier-to-Exit Over Time
EScholar: Electronic Academic Papers for Scholars HackerNoon profile picture

Authors:

(1) Jonathan H. Rystrøm.

Abstract and Introduction

Previous Literature

Methods and Data

Results

Discussions

Conclusions and References

A. Validation of Assumptions

B. Other Models

C. Pre-processing steps

4 Results

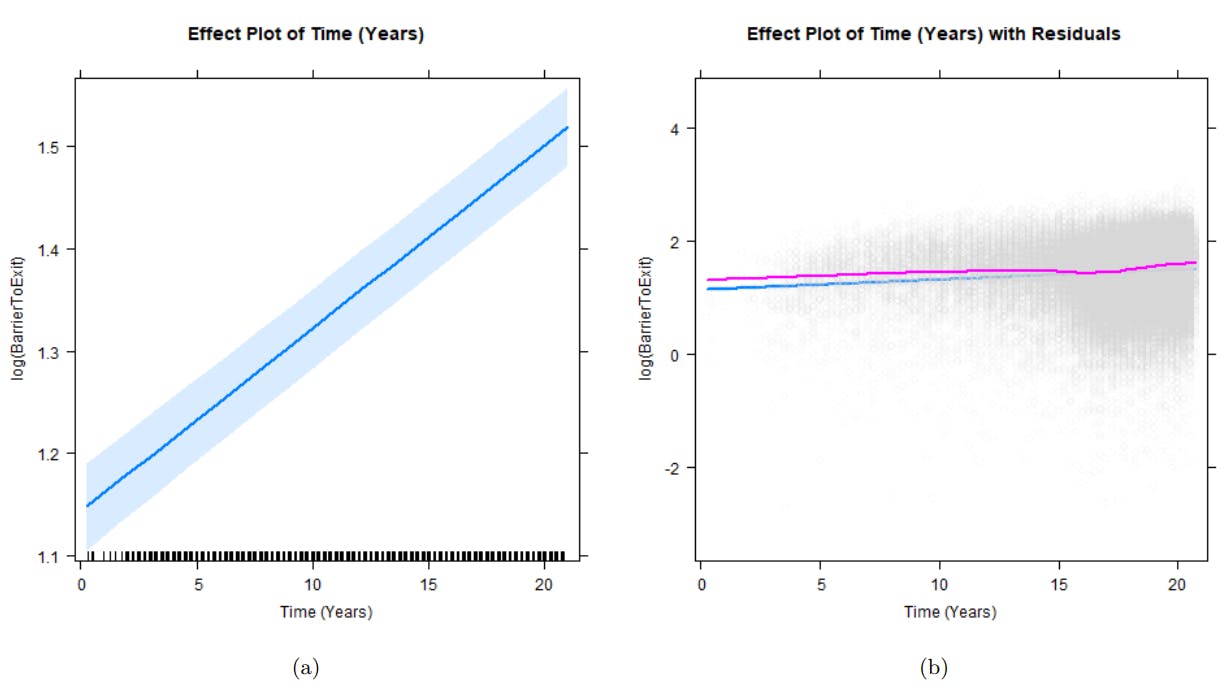
The results from the model can be seen in table 1. The coefficient for time is 0.018 (SE=0.001). This implies growth in Barrier-to-Exit of 1.8% per year. This is highly significant (T=29.95, p ≪ 0.0001). The coefficient for activity level is 0.614 (SE=0.001), which is also highly significant (T=450.11, p ≪ 0.0001).


Table 1: Main Results


Figure 4: Effect plots for Year. 4a shows the partial effect plot. 4b shows the same but with residuals added. TheX-axis show years after the beginning of the dataset (1998 = 0). The pink line in Fig. 4b is a non-parametric line of


A visual representation of these models can be seen in figure 4. The partial effects plot (Fox, 2003) in fig 4a shows an increase in Barrier-to-Exit from approximately 1.15 to 1.5. This translates into a growth of approximately 43% over the duration of the study. Fig. 4b shows the effect plot with residuals.


This paper is available on arxiv under CC 4.0 license.