paint-brush
Monitor Nginx Metrics with GrafanaDR: A Step-by-Step Guideby@mykolaprokopenko
2,154 reads
2,154 reads

Monitor Nginx Metrics with GrafanaDR: A Step-by-Step Guide

by Mykola ProkopenkoNovember 14th, 2021
Read on Terminal Reader
Read this story w/o Javascript
tldt arrow

Too Long; Didn't Read

Nginx acts as a load balancer between services, you can track the request time between all of them. There are several instances where the application is running and where Nginx is used as a balancer. Not many tools are able to collect request time, and this was a very priority in our case. After a little googling, I found an [nginxlog-exporter] tool that displays metrics on a specific port by default, 4040. Based on the documentation, it’s clear that you can supply the exporter as a deb package, which is quite suitable for your small project.

Company Mentioned

Mention Thumbnail
featured image - Monitor Nginx Metrics with GrafanaDR: A Step-by-Step Guide
Mykola Prokopenko HackerNoon profile picture

Have you ever had issues with monitoring Nginx performance? In our recent project, my team needed to track down the time of requests in an already running Nginx web server. Since Nginx acts as a load balancer between services, you can track the request time between all of them. In this post, I want to share my expertise and show you an efficient way of collecting Nginx metrics.


Let's imagine that you have a small project where not everything (or nothing) is containerized. Therefore orchestration, convenient loki, and other tools for monitoring and analytics of requests are not used (but if I missed something, you can correct it in the comments).


The task

There are several instances where the application is running and where Nginx is used as a balancer. We need to understand:

  • the average request time,
  • requests per second,
  • response code and their intensity,
  • traffic volume per unit of time,
  • and so on.


Initial data

There is Prometheus + Grafana monitoring, where you will display graphs of the activity of your service.


Research

As it turned out, there are quite a few Nginx exporters. One of the most popular is nginx-prometheus-exporter and grafana works well with it. But unfortunately, not many tools are able to collect the request time, and this was a very priority in our case. After a little googling, I found an nginxlog tool that displays metrics on a specific port by default, 4040. You can find more information about this tool here. Once I’ve run some small tests, it became clear that it is suitable for our case.


Configuration

To configure the format of our logs, you need to l set such parameters in the Nginx config, which will be located in /etc/nginx/conf.d/

Let's set the format - just add the follow setting into the custom-log-format.conf:

log_format custom '$remote_addr - $remote_user [$time_local] "$request" $status $body_bytes_sent "$http_referer" "$http_user_agent" "$request_time"';

On the next step, go to /etc/nginx/sites-enabled/sitename - your web server config, and add the lines:

access_log /var/log/nginx/sitename-access.log custom;
error_log /var/log/nginx/sitename-error.log;


After that, you need to check Nginx configuration:

nginx -t


If you performed all the operations correctly, you’ll see the following lines

Then, Nginx needs to re-read the configs:

service nginx reload


And now you can install nginxlog-exporter. Based on the documentation, it’s clear that you can supply the exporter as a deb package, which is quite suitable for your small project, both for now and for future automation using Ansible.

Now, let’s download the package:

wget https://github.com/martin-helmich/prometheus-nginxlog-exporter/releases/download/v1.8.0/prometheus-nginxlog-exporter_1.8.0_linux_amd64.deb -P /tmp


Install this package using the apt package manager:

apt install /tmp/prometheus-nginxlog-exporter_1.8.0_linux_amd64.deb


Next, you need to create a file: /etc/prometheus-nginxlog-exporter.hcl


Which is the configuration file of your exporter, and which should contain:

listen {
  port = 4040
  address = "<server_ip>"
}

namespace "frontend" {
  source = {
    files = [
      "/var/log/nginx/sitename-access.log"
    ]
  }

  format = "$remote_addr - $remote_user [$time_local] \"$request\" $status $body_bytes_sent \"$http_referer\" \"$http_user_agent\" \"$request_time\""

  labels {
    app = "frontend"
  }
}


Nota bene! Pay special attention to the name specified in the namespace. You’ill use this name to build Prometheus requests.


Add your service to autostart:

systemctl enable prometheus-nginxlog-exporter

I took all installation steps from the official developer repository.


Afterward, you need to check the status of your service:

systemctl status prometheus-nginxlog-exporter


If you implemented all commands in the right way, you’ll see the following result:

output of "systemctl status prometheus-nginxlog-exporter"

If you get a message that the service status is inactive, as shown in the picture below:

output of "systemctl status prometheus-nginxlog-exporter" if service didn't startedThen you need to run this command:

systemctl start prometheus-nginxlog-exporter


You can see that the exporter returns to us by going to: <server_ip>:4040/metrics. If there is activity on the frontend, then you can see a list of metrics that will be used in Prometheus and Grafana.


Nota bene! Don't forget to add the server ip and port to your Prometheus config file.


Now, your task is to collect and parse these metrics so that Grafana can draw graphs.


Let's take a look at Prometheus. Try to enter your frontend keyword, which you specified in the namespace block in the configuration. You’ll see the following results:

Prometheus interface

Now, you need to determine what metrics you want to see in your dashboard in Grafana. At the beginning of the article, we were interested in the average responce time.


Next, you can move on to setting up our graphs in Grafana. First, create a new dashboard:

Creating new DashboardAdd the panel:

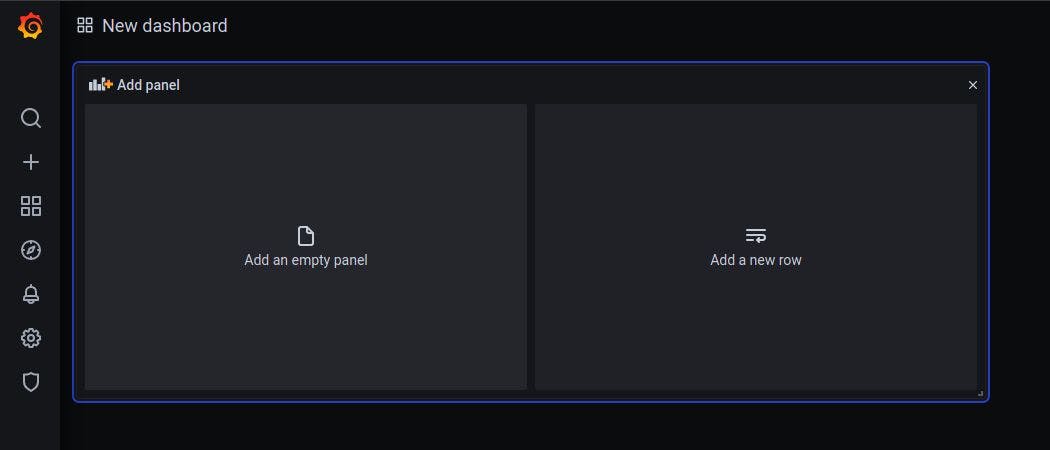
How new dashboard looks like

Then, you need to write a request:

sum(rate(frontend_http_response_time_seconds_sum[5m])) by (app) / sum(rate(frontend_http_response_time_seconds_count[5m])) by (app)


Once you’ve added all the necessary settings to the panel, you’ll see its final appearance:

The final look of the "Average responce time" panel

You can also add additional metrics, for example "Status codes per second"

sum(rate(frontend_http_response_count_total[1m])) by (status,app)


In this case, you’ll have one more panel:

The final look of the "Status codes per second" panel

Correspondingly, you can add other metrics to this panel, if you need it.


Once you set up all the metrics, you can configure alerts. For instance, using Alertmanager. But this is a different case.


A few more examples of queries that can be used by the monitoring system:

Requests per second:

sum(rate(frontend_http_response_time_seconds_count[1m])) by (app)

Http traffic:

sum(rate(frontend_http_response_size_bytes[5m])) by (app)


Conclusion

Now you know how to make your Grafana dashboard more informative. For a deeper analysis, other tools may be needed. But prometheus-nginxlog-exporter is quite suitable for solving such problems. Hope my guide will help you with your next project!


Please, leave the comments below if you have any questions or you just want to share your experience.