In today’s research article, we’ll focus on dissecting Bitcoin’s Four Year Cycle in an effort to better understand Bitcoin’s current price predicament and gain insight into some of the more important technical steps price needs to achieve to ensure future exponential growth.
First, we’ll focus on breaking down the Bitcoin Four Year Cycle into distinct phases in the market cycle. We’ll emphasise the psychology that underpins each of these phases.
Secondly, we’ll discuss how the pandemic-induced crash in March 2020 was in fact a theoretically sound correction through the lens of Bitcoin’s historically recurring pre-Halving price tendencies.
Then, we’ll emphasise the importance of the Bitcoin Halving in shaping Bitcoin’s Four Year Cycles.
Later, we’ll talk about what Bitcoin needs to technically achieve to open itself up to significant upside in 2021 so as to reach a new All Time High.
And finally, we’ll investigate how the Four Year Cycle brings to light some crucial observations about Bitcoin’s price behaviour and discuss how these observations could inform us as to its potential price growth in the future
This content was originally featured in the Rekt Capital newsletter
Bitcoin - The Four Year Cycle
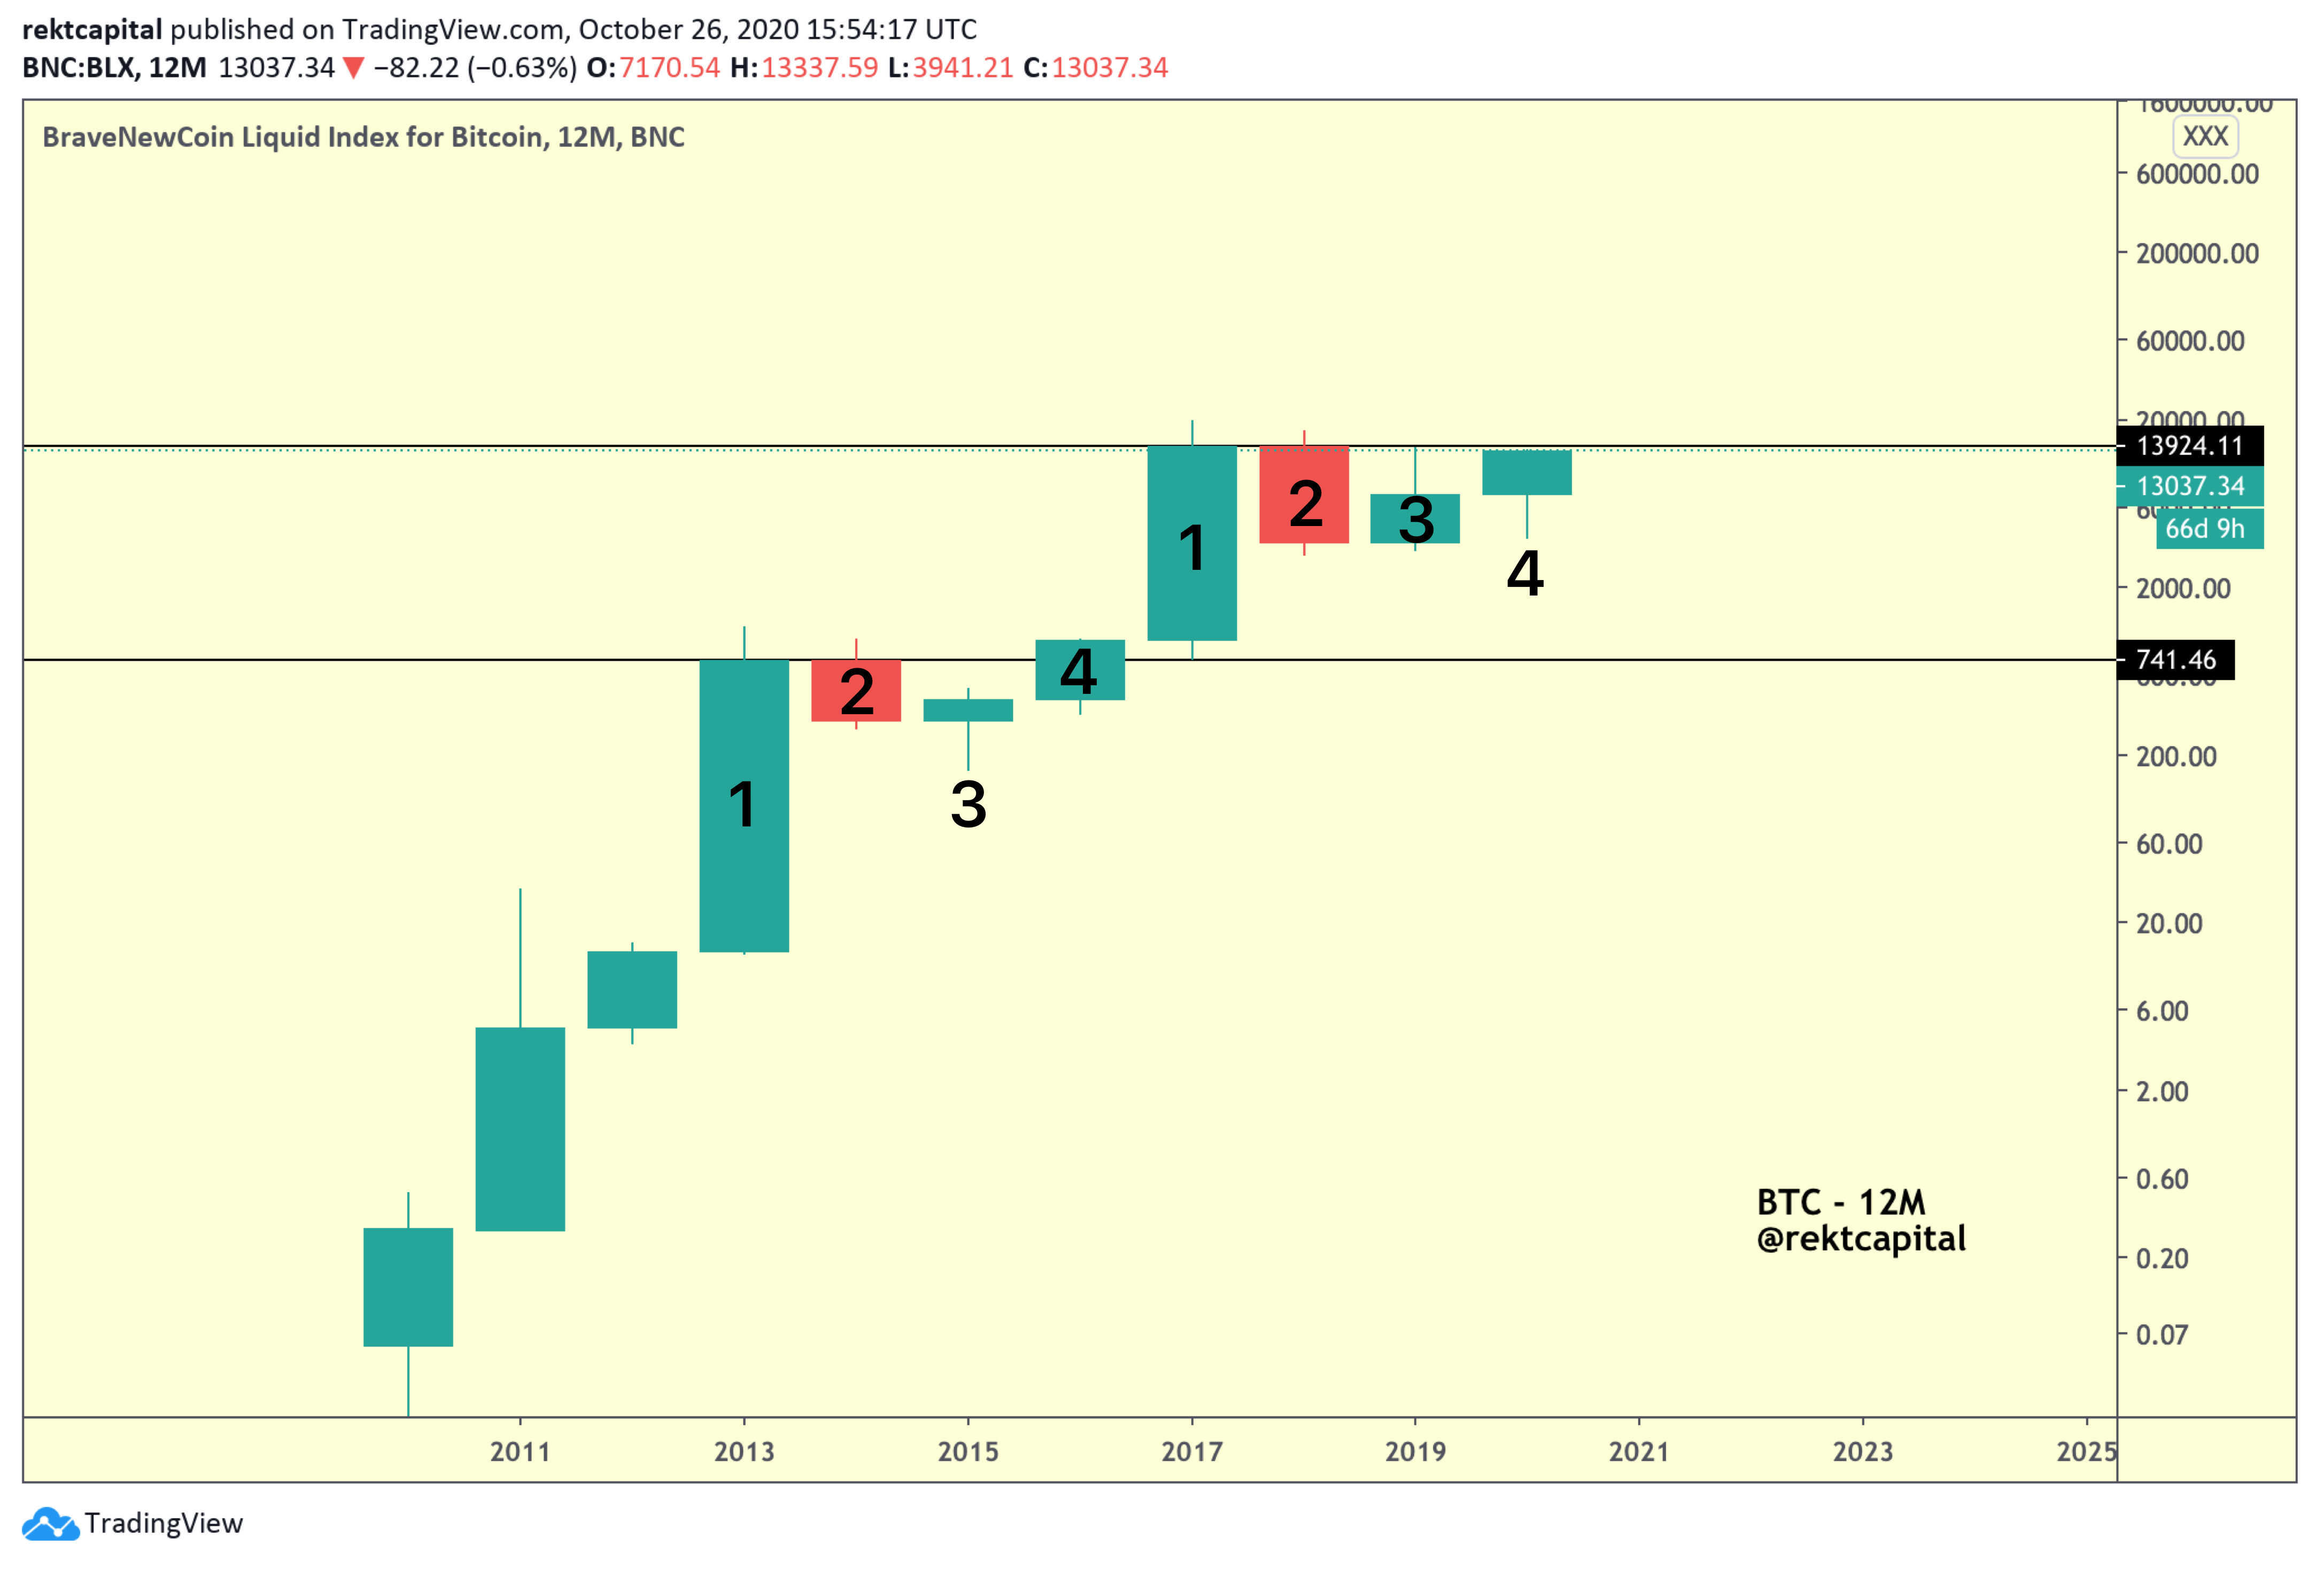
The twelve month candlesticks on Bitcoin’s price chart showcase a recurring theme to form Four Year Cycles.
Each twelve month candle denotes a specific phase in the Four Year Cycle.
Here is a breakdown of each of these phases:
Phase 1 — Exponential Highs
This candle highlights the exponential nature of the uptrend that leads Bitcoin to new All Time Highs.
It is at this stage in the market where investors are at their most euphoric and experience the most extreme form of “the fear of missing out.”
It is these extreme emotions that compel investors to buy at higher and higher prices. This prolongs the bull trend and presses price to new exponential highs.
This phase is also the “topping out” phase where Bitcoin reaches its new All Time High and price peaks.
Phase 2 — Correction
Following the euphoria of the previous twelve month candle, this phase corrects for the over-exuberance and overoptimism in the market.
It is during this time that Bitcoin sheds considerable valuation as a result of cascading sell-side pressure from profit-taking investors.
Bitcoin experiences a healthy retracement after an exponential growth cycle.
Phase 3 — Accumulation
After an extended correction in price, Bitcoin experiences waning sell-side momentum and begins to bottom out.
This is where bargain buyers tend to step in and accumulate Bitcoin at a deeply discounted prices. It is these types of buyers that form the very beginnings of new demand for Bitcoin.
Phase 3 happens to be the point of maximum financial opportunity for Bitcoin investors as the prospect of reward greatly exceeds the risk of downside.
Phase 4 — Recovery and Continuation
The bottoming out period is over and a new uptrend has been confirmed as price experiences trend continuation towards the upside.
In the context of Bitcoin’s twelve month candlesticks, historically this phase has been all about eclipsing a previous area of sellside pressure (i.e. “resistance” whereby sellers resist price from continuing to the upside; this level is denoted by a black horizontal line).
It is during this period where a twelve month candle close above that level of resistance is an important technical step in confirming a shift in market psychology at said level.
This level is a key psychological inflexion point that tends to spur strong emotions in the market and resulting buy-side momentum.
Upon a successful twelve month candle close, this is when market psychology at this key switches from selling to buying.
Did The March 2020 Crash Distort The Four Year Cycle?
Pre-Halving Retrace Complete ✅
It’s true that the pandemic-induced sell-off caused Bitcoin to deviate from its historically recurring tendencies.
In the grander scheme of Bitcoin’s overall price history however, this deviation wasn’t as substantial as most might think.
In fact, this retrace was historically sound; after all, pre-Halving retraces occur a few weeks prior to the Halving. This was a pre-Halving retrace.
Let’s briefly recount Bitcoin’s pre-Halving retraces across time:
Bitcoin experienced a -50% retrace approximately 100 days prior to Halving #1 in 2012 and lasted 2 days.
Bitcoin experienced a -38% retrace approximately 24 days prior to Halving #2 in 2016 and lasted 44 days.
Bitcoin experienced a -63% retrace approximately 88 days prior to Halving #3 in 2020 and lasted 29 days.
So while Bitcoin’s crash in March was anomalous in terms of how deep it was, the fact that a significant correction occurred prior to the Halving was theoretically sound and in line with Bitcoin’s historically recurring pre-Halving price tendencies.
I first emphasised this “pre-Halving retrace” price tendency in my September 6th, 2019 article called “Bitcoin Halving - Everything You Need To Know”.
Here’s the relevant excerpt from that article
So while the March 2020 crash was anomalous to some degree (i.e. retrace depth), it was generally in line with historically recurring price tendencies Bitcoin tends to showcase prior to its Halvings.
And as I mentioned in my recent research article Bitcoin Halving: A Historical Analysis (which is an up-to-date analysis of all Bitcoin Halvings), Bitcoin has in fact reclaimed its key higher-timeframe market structure since the March 2020 crash and will now be challenging key resistances to actually resynchronise with its previous market cycles.
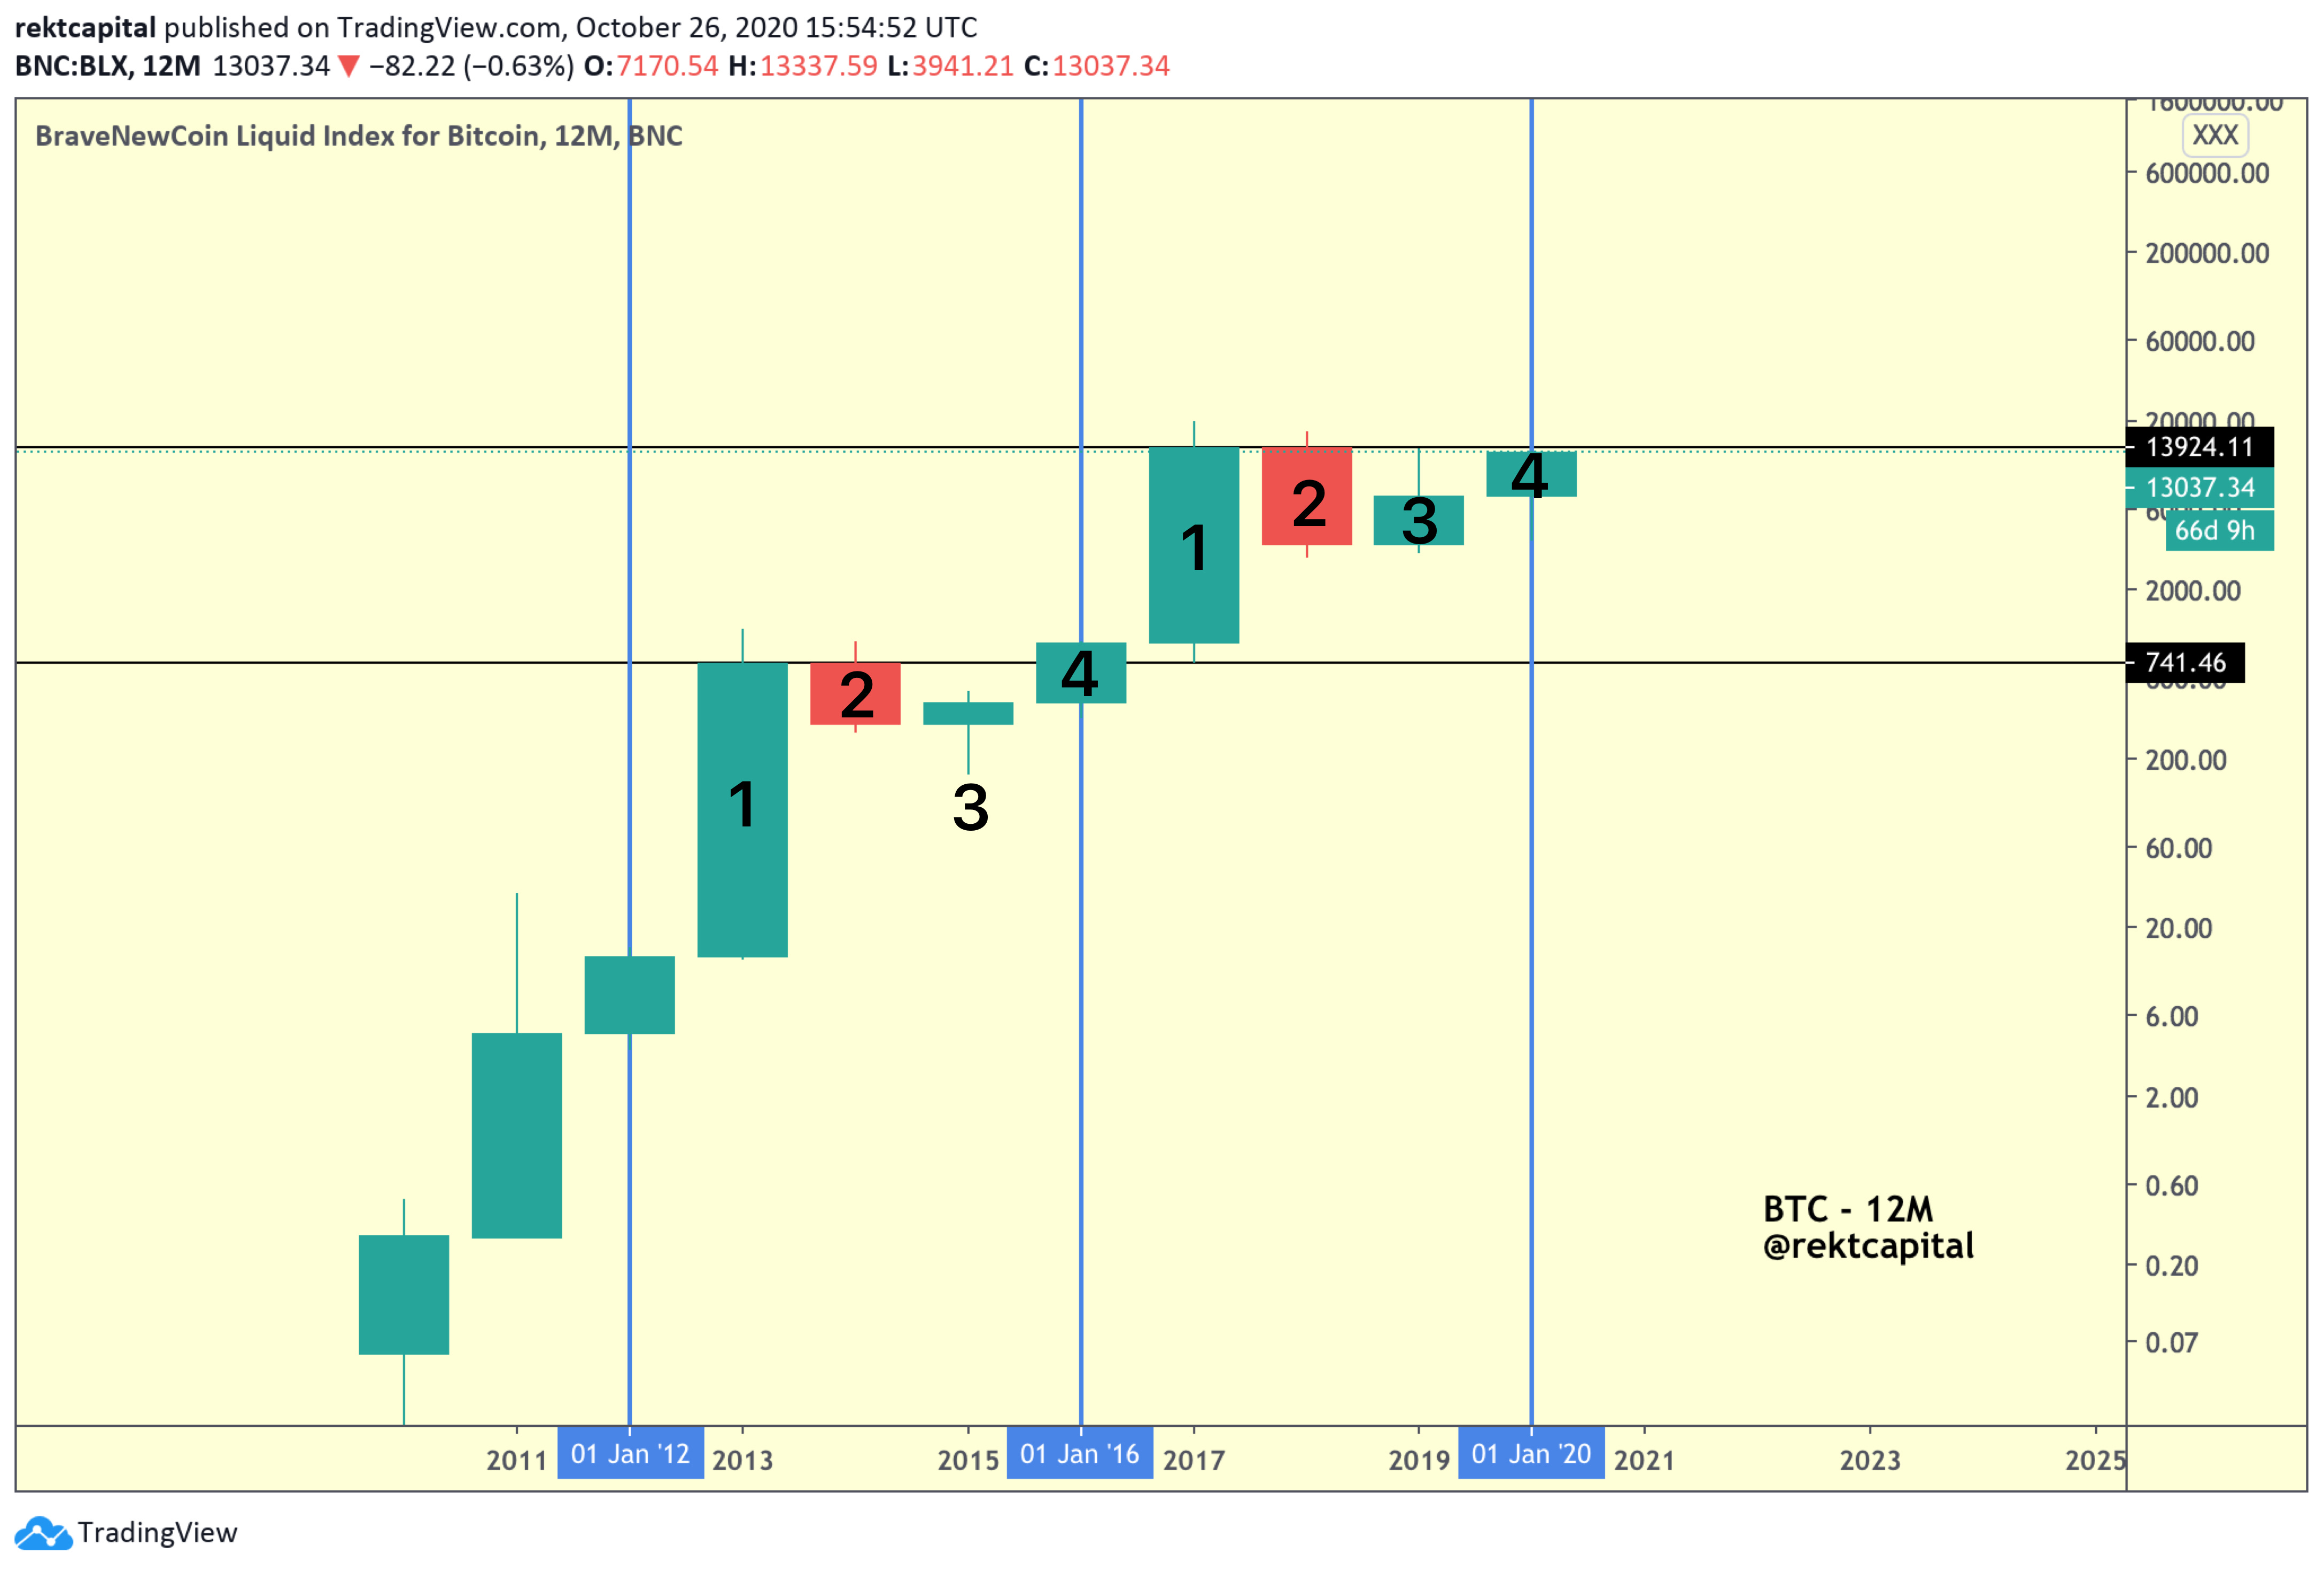
Bitcoin Halving and The Four Year Cycle
The Bitcoin Halving is an event whereby the amount of new Bitcoin that gets created every 10 minutes gets cut in half (denoted in blue on the price chart).
In May of this year, Bitcoin’s third Halving took place, reducing the block reward of 12.5 Bitcoin every 10 minutes to 6.25 Bitcoin.
Not only does the Bitcoin Halving mark a fundamental change in the Bitcoin protocol, but it also has tremendous ramifications for Bitcoin’s price as well.
Historically, Bitcoin has rallied exponentially after each of its Halvings.
Bitcoin rallied +3,400% after Halving 1 and 4,080% after Halving 2.
It is a fundamental catalyst that has played a significant role in propelling Bitcoin’s price to exponential highs.
And the fact that I’ve discussed the pre-Halving retrace in the context of Bitcoin’s Four Year Cycle is no coincidence.
Because the Bitcoin Halving events occupy a curious price positioning if we analyse them through the lens of the Four Year Cycle.
In the context of the Four Year Cycle, the Bitcoin Halving occurs in the “Recovery and Continuation” candlestick (i.e. Candle 4) and precedes the new exponential Candle 1 in the new Bitcoin Four Year Cycle.
In other words - the Bitcoin Halvings tend to occur a year prior to Bitcoin’s exponential rallies to new All-Time Highs.
Bitcoin Set For New All Time High In 202
According to the 4 Year Cycle, Bitcoin is currently in Phase 4.
That means Bitcoin is in the final phase of its current Four Year Cycle.
And the primary aim of Phase 4 is to eclipse the previous resistance that effectively prompted a bear market for Bitcoin’s price a few years earlier (i.e. “Candle 2”).
That resistance is ~$13,900.
So for the 4 Year Cycle to continue to play out, Bitcoin needs to manage a twelve month candle close above the ~$13,900 price level by the end of 2020 so as to precede an exponential Candle 1.
At the time of this writing, Bitcoin is really not that far away from eclipsing ~$13,900.
Bitcoin’s current twelve-month candle still looks healthy, with a great deal of bullish momentum behind it.
It has taken the shape of a bullish hammer candlestick, resembling the bottoming out candle from the previous Four Year Cycle which preceded immense upside in of itself.
And hammer-shaped candlesticks tend to precede bullish trend reversals towards the upside.
As per the historical tendencies of the 4 Year Cycle, a twelve month candle close above ~$13,900 is the technical confirmation that is necessary to open Bitcoin up to a challenge and subsequent eclipse of $20,000 to reach a new All-Time High in 2021.
How Much Could Bitcoin Rally In 2021
To address the question of where Bitcoin could rally to in 2021, we have to take into account a few noteworthy technical tendencies that can be observed by dissecting Bitcoin’s Four Year Cycle:
If BTC Breaks $13900 in 2020, BTC Will Not Eclipse $20000 in 2020
If Bitcoin manages to perform a twelve-month candle close above $13,900 that would mean Bitcoin would eclipse $13,900 this year to make a new cycle high, but not eclipse the old All Time High of $20,000.
Nonetheless, a twelve-month candle close above $13,900 that would open Bitcoin up to enter a new exponential Phase 1 in a new Four Year Cycle.
That is, a new All Time High would await in 2021.
Bitcoin To Turn $13,900 Into Support in Early 2021
Upon successful twelve-month candle close above $13900 in 2020, Bitcoin would attempt a retest of $13900 as support very early on in 2021, before embarking on a new exponential rally to establish a new All Time High.
This is a necessary technical prerequisite that Bitcoin has performed throughout history.
This is when key Four Year Cycle resistances (i.e. previously black horizontal levels) change from being a source of sell-side momentum (i.e. red horizontal level) to a source of buy-side pressure (i.e. green horizontal level)
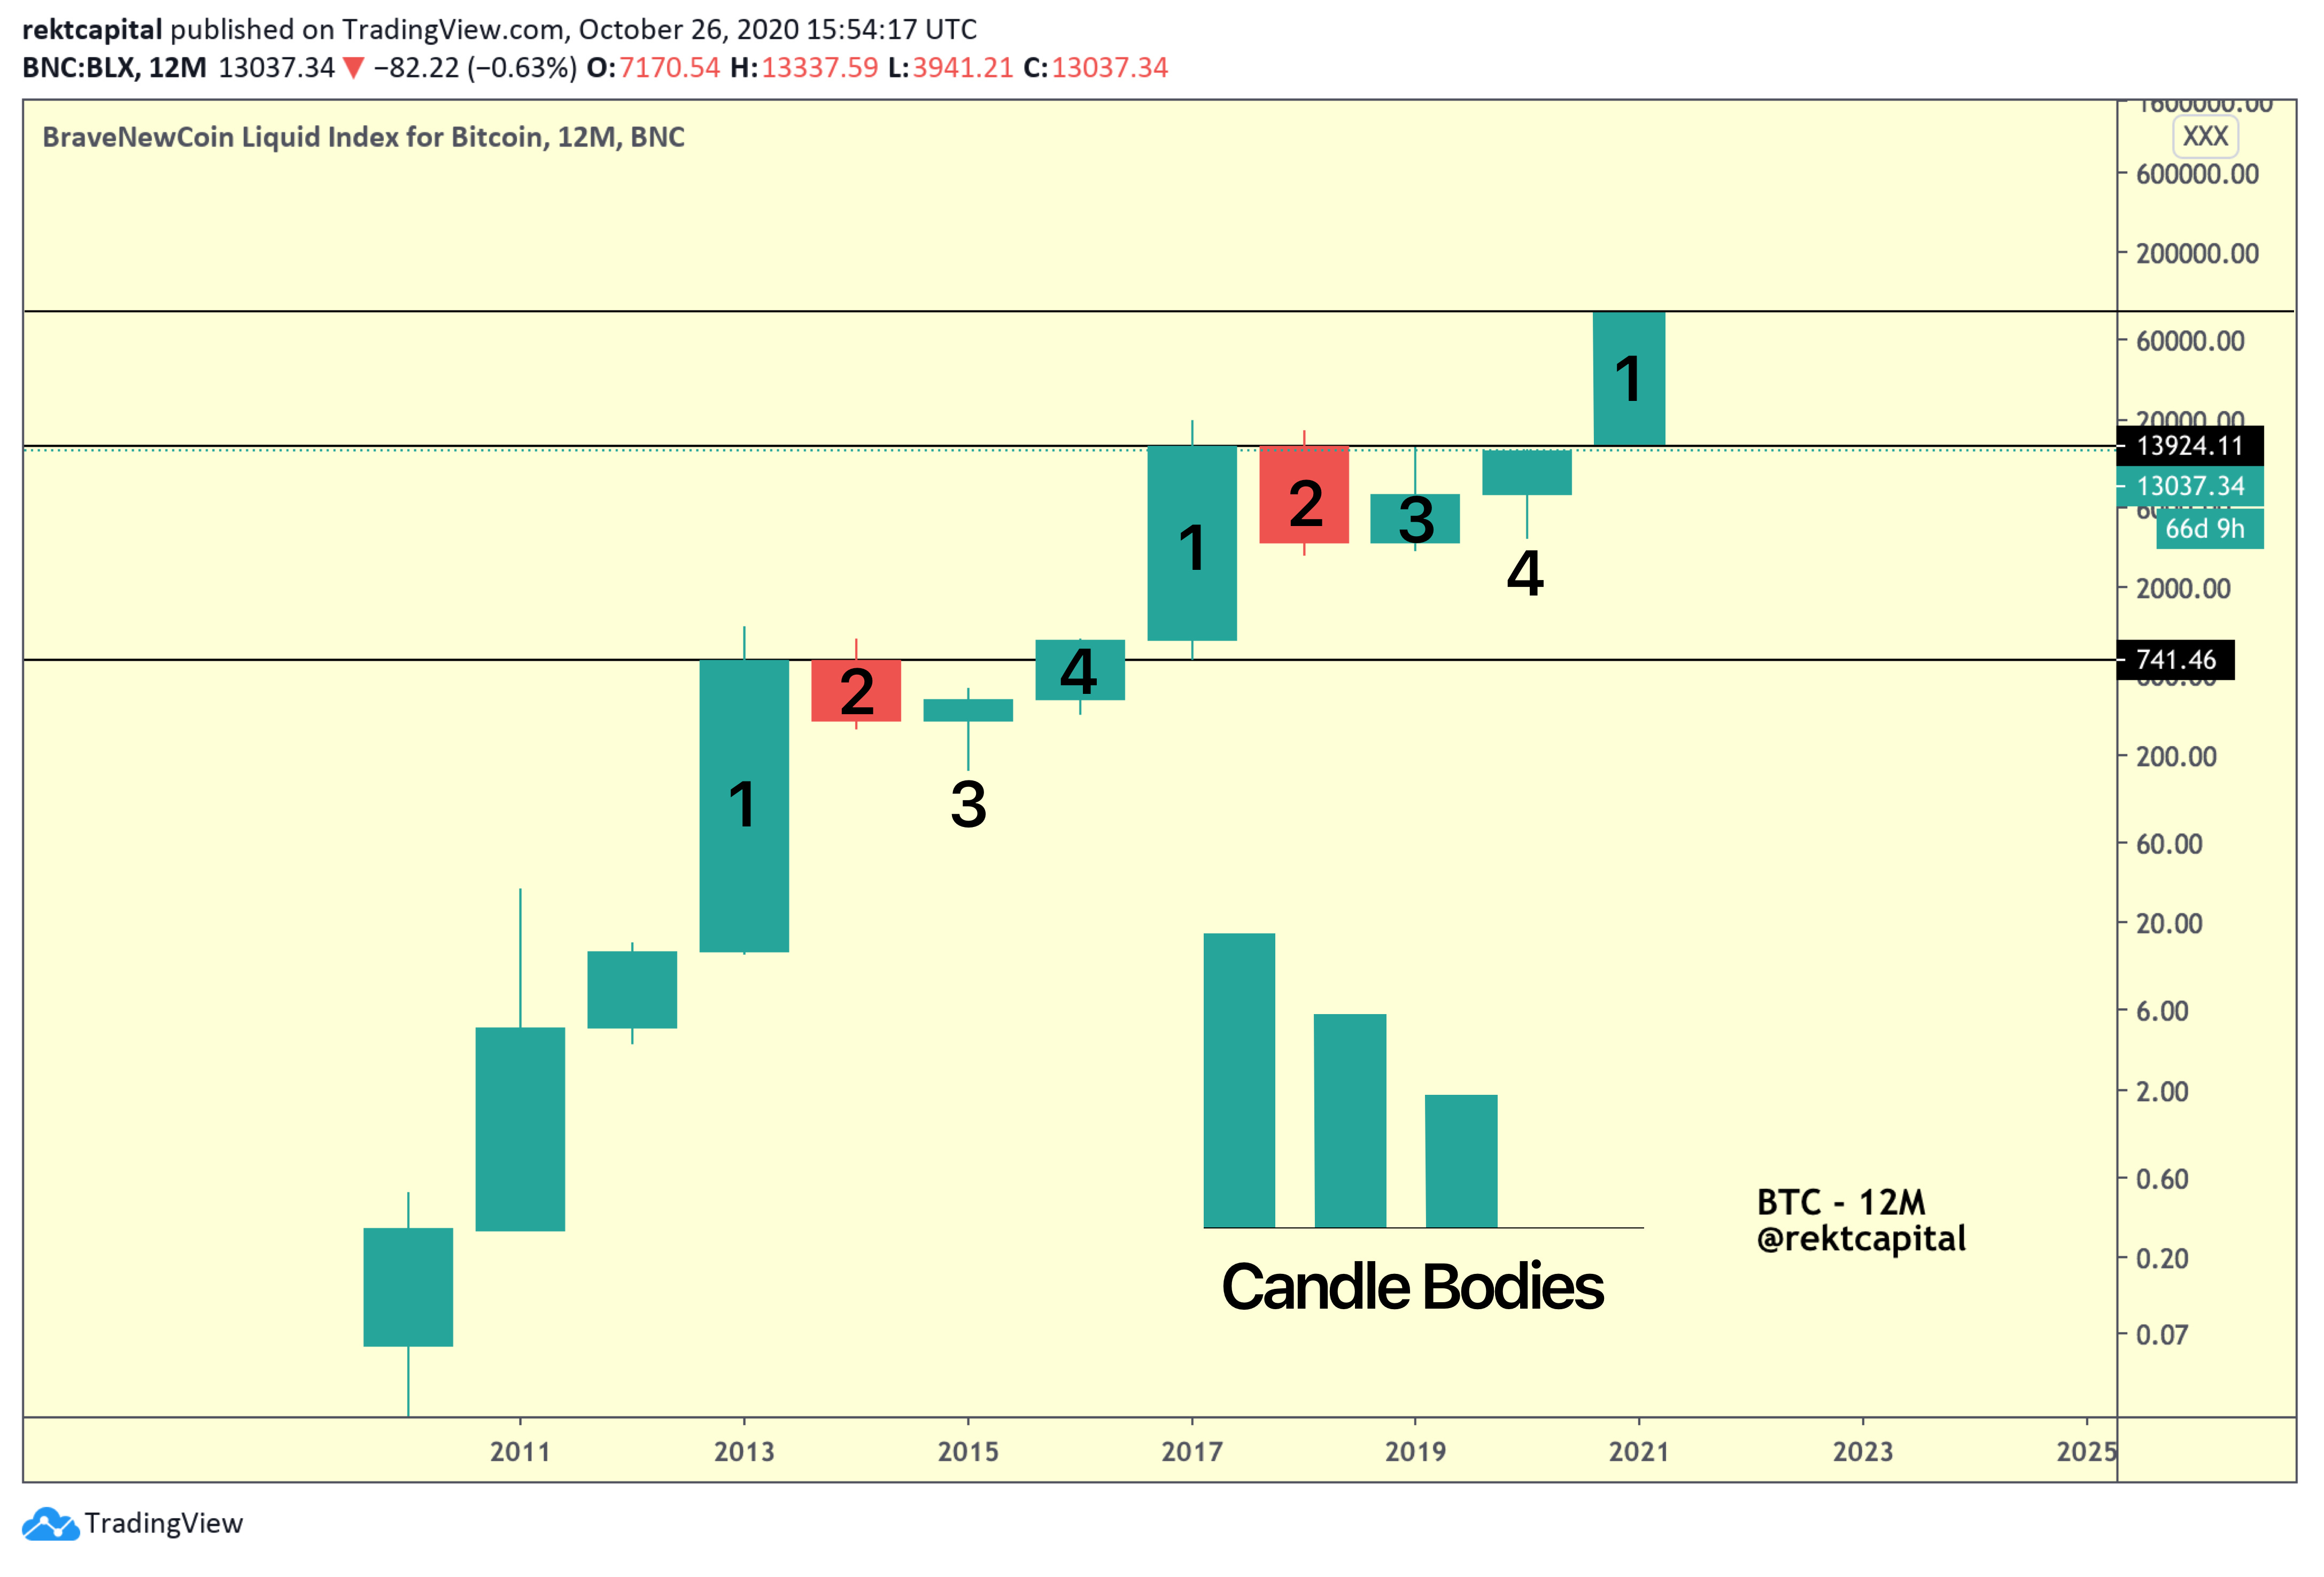
Diminishing Rate of Return on Bitcoin Investments
It is Phase 1 candles that springboard Bitcoin to new All Time Highs.
At a glance at the price chart above however, the exponential Phase 1 candles appear to produce less exponential rallies over time (i.e. black arrows).
That means Bitcoin’s next exponential Phase 1 in the new Four Year Cycle will likely be less exponential than previous Phase 1’s.
It is likely there are diminishing returns after each Bitcoin Halving.
Much like the actual Phase 1 twelve-month candlesticks, the rate of overextension in the form of upside wicks past these crucial Four Year Cycle resistances (i.e. black horizontal levels in the chart below) are also getting shorter and less volatile over time.
Where Could Bitcoin Rally To In 2021?
If we assume the rate of diminishing Post-Halving returns to remain constant across all exponential “Candle 1’s”, Bitcoin could rally exponentially to a relatively conservative new All Time High of ~$90,000.
That said, this conservative extrapolation of current Post-Halving bull trends by standards of Bitcoin’s price history doesn’t account for upside wicks past key Four Year Cycle resistances (i.e. black horizontals).
This means Bitcoin could very well overextend past $90,000 and even beyond the psychological level of $100,000 before finally rejecting.
P.S. Thank you for reading and feel free to sign up to my newsletter for more crypto insights.
Also published at https://rektcapital.substack.com/p/fouryearcycle