paint-brush
I Used Python To Analyze My Peloton Workout Stats With Real-Time Updates by@alchen
1,011 reads
1,011 reads

I Used Python To Analyze My Peloton Workout Stats With Real-Time Updates

by Al ChenJanuary 17th, 2021
Read on Terminal Reader
Read this story w/o Javascript
tldt arrow

Too Long; Didn't Read

A tutorial on how you can sync and analyze your Peloton workout stats into Coda with custom dashboards. Sync with a Google Apps Script or serverless function on

Companies Mentioned

Mention Thumbnail
Mention Thumbnail

Coin Mentioned

Mention Thumbnail
featured image - I Used Python To Analyze My Peloton Workout Stats With Real-Time Updates
Al Chen HackerNoon profile picture

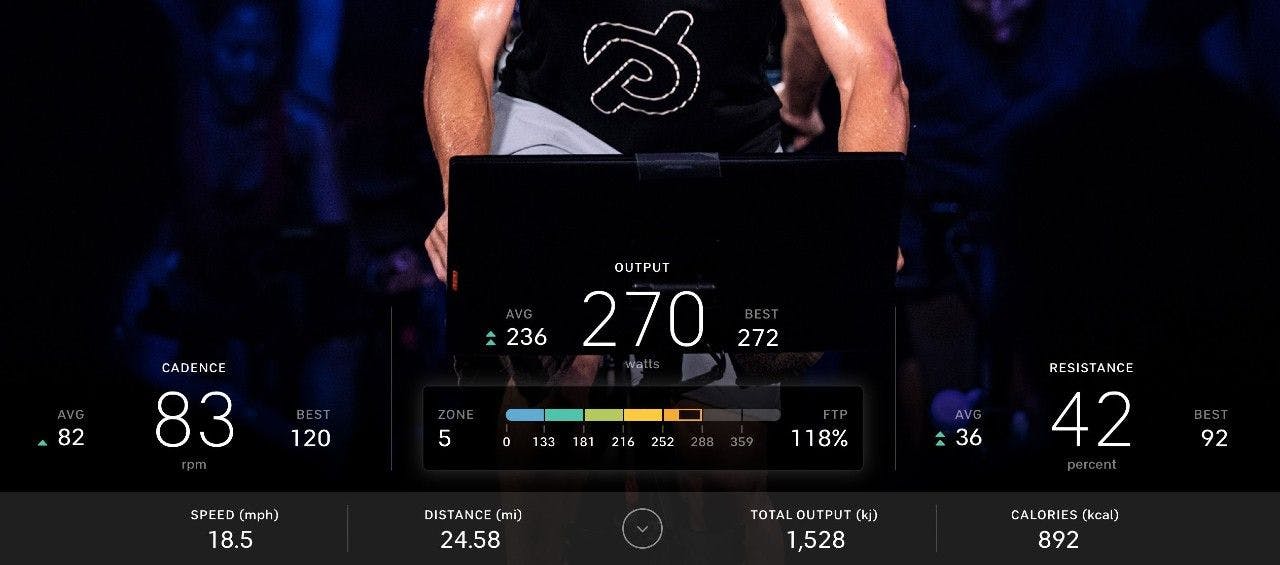
Now that gyms are closed, I’m using Peloton more and I love how Peloton tracks everything. But I always found it difficult to browse through previous workouts with the user interface on the tablet on the bike. What if I wanted to see summary stats just for 20-minute classes? What are my personal records for a given time period? I know they exist on the app somewhere, but I just want one place to visualize and analyze the data that matters to me.

I looked into how to get my Peloton data to do some custom sorting, filtering, and analysis. After a few weeks, I realized I could get automated updates to a Coda doc with all my Peloton stats. Read below to see how I was able to get these near-real-time stats synced to Coda.

👉 Go straight to the template and copy it. The template contains this write-up as well as the tables and views you need to analyze your own Peloton workout stats. Go to the Cycling page to see the cycling dashboard I’ve always wanted for myself. Use the Google Apps Script or Python script to start syncing your Peloton data (step-by-step instructions here). Video tutorial below:

See your workout stats on Peloton’s website

You’ve probably used the Peloton website before to view your workouts. Similar to the bike tablet, however, you have to click into each workout to see the stats for that individual workout:

If you click on the “Overview” and “Achievements” tabs, you’ll see some additional information about your workouts that might be useful. I just really wanted to see the stats associated with my bike rides, and those stats are “trapped” in each individual workout. You can’t see your output, calories, etc. over time.

Download a CSV of your workout stats

In the top right of the screenshot above, however, is a “Download Workouts” button. This lets you get a CSV download of all your workout data which is pretty sweet! This has most of the info I care about:

Some of the columns include 

Length
Type
Total Output
, and 
Avg. Watts
. This means you can start answering questions like:

- What was my max output for 45-minute classes?

- What was the max average cadence for each instructor I’ve taken a class from?

- How has my average output been trending over time?

For many of you, this CSV should be enough for you to analyze your bike and non-bike workouts. You can throw this data into a spreadsheet (or a Coda doc 🙂), build some charts, and be on your merry way. Any time you want to get your most updated stats, just download the CSV and plug it into your spreadsheet or Coda doc.

For me, I wanted to see additional stats and automate the process of updating my stats. I don’t want to download the CSV and copy and paste the data into Coda every time I finished a workout.

Specifically, some questions I wanted to answer were:

- Can I get stats like 

Difficulty
 (based on ratings submitted by Peloton members), 
Leaderboard Rank
, and additional info about Peloton instructors?

- How can I automate the process of getting my stats into a Coda doc without downloading a CSV?

Playing with the unofficial Peloton API

Turns out a few people have dabbled with the unofficial Peloton API. This one from Pat Litke is probably the most well-documented project. This library is great if you want to build a custom application on top of the Peloton API, but I wanted to find a way to simply get the data out from my Peloton account and into Coda.

Turns out there are quite a variety of endpoints off of https://api.onepeloton.com. You can get data about your Peloton account, instructors, and most importantly, your workouts. Here is a sample of data you can get about your account after authenticating with your username and password:

Some high-level data about your workouts:

After some more searching, there’s an API explorer on SwaggerHub showing all the endpoints you can ping on the Peloton API. One of the more interesting endpoints is 

api/workout/{workoutId}/performance_graph
 where you can get second-by-second metrics like output, resistance, and more:

With this data, you can build your own workout chart like the one you see on the bike tablet or on the website:

So I know the data is there, I just need to figure out which metrics I want and the charts and I want to see.

Picking the right Peloton workout metrics

At the very least, I wanted to get the metrics you get from the CSV output. So those columns are a given. The additional metrics and stats I wanted to get include:

- Leaderboard rank — And total leaderboard users too.

- Difficulty — a crowdsourced rating from 1–10 you give after a workout.

- Total workouts — the total number of workouts others have done for this workout (gives you a sense of the popularity of the workout).

- Total ratings — correlated with Total workouts and is just interesting to see which workouts people provide ratings for.

- Instructor data — basically anything you can find on this Peloton instructors page.

There’s a whole plethora of metrics you can get from the API but these were the ones I wanted to see in addition to the properties from the CSV. You can see every metric I pull in from the All workouts page.

Main cycling dashboard

If you go to Cycling, you’ll see the main “dashboard” with the stats I wanted to see.

You can get from the last 10 rides on the tablet or from the website, but it’s all in one place. Additionally, this list gets re-sorted every time new workouts get synced over from Peloton in All workouts. You can also filter the list by the length of the workout so that you are doing an apples-to-apples comparison. This is a nice condensed list to see how my workouts have been trending recently:

View of 10 most recent workouts on the Cycling dashboard

Below that 10 latest workouts table, I have a Personal Records table that just shows the best workouts I’ve had by workout lengthAgain, this is all data you can get from the CSV download, but the main difference is that this data gets updated automatically every hour, day, week, or whatever interval works for you.

Personal records by workout length

Finally, the charts below these tables show metrics over time so I can get a sense of how my performance have improved or declined over time.

Key views of Peloton workout stats

In sub-pages of the Cycling page, I sliced and diced my data based on different views I wanted to see my workouts. For instance, I’ve always wanted to see one view of my workouts grouped by workout length and then sorted by output (kj). Seeing the dates when I reached a really high output encourages me to work harder to get back to that level of performance. You can see this view in By length.

Another view I’ve always wanted to see is how my stats look grouped by instructor. Maybe certain instructors are more encouraging and therefore lead me to better performance. That’s what the By instructor page allows me to see. Looks like I’ve taken quite a few classes with Matt Welpers 💪.

Finally two other views I thought would be interesting for cycling workouts are:

- By leaderboard rank — See your workouts sorted by your position on the leaderboard. These are stats that you can’t get in the CSV, so it’s neat to see which rides I’ve performed the best in relative to all other Peloton members.

- Calendar — While there is a calendar on the tablet and website, this view color-codes the events by workout type. This means you can see other workout stats like running, strength, meditation, etc.

Two additional pages I set up to quickly sort and filter through Peloton data are:

-Filter Workouts — Filter across all different dimensions

- Browse Instructors — See the profiles for all your favorite instructors (this list also gets updated in the sync as new instructors are added)

Syncing data in “real-time” from Peloton to Coda

What good are these charts and tables if they don’t stay updated? Since we know the API exists, I wanted to find an automated process for keeping the workout data in my Coda doc up to date with my workouts on Peloton.

Caveats about Peloton API

Caveat #1: As I mentioned earlier, the Peloton API is unofficial and undocumented. This means Peloton (the company) has not “blessed” the use of their API for the public, so the API could change at any time. This would essentially break the scripts I’ve written to sync data over from Peloton to Coda.

Caveat #2: As with any API, you may use the API too aggressively and the fine folks at Peloton might rate-limit you. Don’t be the guy or gal who runs these scripts every minute thinking you need near-real-time updates. In reality, a daily sync would probably be sufficient for most of you out there. Long story short - be nice or else Peloton might block your use of their API 🚫.

Google Apps Script

If you’ve come across my other published docs, you’ve probably noticed I’m a big fan of Google Apps Script. It’s a low-code, scalable, and most importantly, free tool to connect your different tools together. Of course, Google makes it super easy to get data in and out of Google products, but you can set up workflows between non-Google tools as well.

The reason I think Google Apps Script is the right solution to sync your workout data from Peloton to Coda (as of the writing of this post) is because you can set up time-driven triggers. These are basically the rules for how often you want the script to run. As I mentioned in the caveats above, I would highly recommend setting a daily interval as the highest frequency to run the Google Apps Script.

Authentication with Peloton

This was probably the most difficult part of the script to figure out. In order to get your Peloton stats, you have to provide your username and password so that Peloton knows that you are, well, you!

In the Google Apps Script, there is a 

UrlFetchApp
 class that lets you fetch any URL and convert the response to a JSON object. This part of the authentication code allows you to “login” to Peloton by submitting an 
options
 parameter that contains your Peloton login details:

var base_url = 'https://api.onepeloton.com'
var options = {
  'method' : 'post',
  'contentType': 'application/json',
  'payload' : JSON.stringify({'username_or_email': PELOTON_USERNAME, 'password': PELOTON_PASSWORD}),
  'muteHttpExceptions' : true
};
var login = UrlFetchApp.fetch(base_url + '/auth/login', options);

The problem: We need to make various other calls to the API and those calls won’t be authenticated. Peloton won’t just give you workout data for anyone just because you know their Peloton username. This is where the cookie for the login session comes into play:

var cookie = login.getAllHeaders()['Set-Cookie'];

The 

getAllHeaders()
 method returns all the header information from the HTTP response (which contains the cookie we need). We just store the relevant attribute in the 
cookie
 variable.

Another problem: The cookie object returned from the headers looks like this:

[ "__cfduid=d88dc31d26154890903e4ed470ce2d2d31610584581; expires=Sat, 13-Feb-21 00:36:21 GMT; path=/; domain=.onepeloton.com; HttpOnly; SameSite=Lax", "peloton_session_id=57c891b1d8004745b7f19280a25af2cb; Domain=.onepeloton.com; HttpOnly; Max-Age=2592000; Path=/; SameSite=Lax; Secure; Version=1", "__cfruid=14a3728b6c055fbcd9384022acdfdf91f2ec912e-1610584582; path=/; domain=.onepeloton.com; HttpOnly; Secure; SameSite=None" ]

There are all these expiration and domain attributes we don’t need. So, we just need the 

cfduid
peloton_session_id
, and 
cfruid
 as one long string, so this part of the authentication function creates that string for us:

for (var i = 0; i < cookie.length; i++) { cookie[i] = cookie[i].split(';')[0] }
var authenticated_options = {'headers': {'Cookie': cookie.join(';')}}

Now we have this variable 

authenticated_options
 we can use it for all our subsequent calls with the API so that Peloton knows we are still “logged in” to our Peloton account.

Getting existing Peloton workouts from Coda

The first time you run the script, all your workouts will get synced over to the Workouts table. To prevent unnecessary calls to the API, the script first pulls all the workout IDs from the Workouts table and compares them with the workout IDs returned from the API. We only look at the new workouts that need to be synced over to Coda since previous workout data won’t change.

Remember the 

api/workout/{workoutId}/performance_graph
 endpoint I mentioned earlier? Turns out that returns a ton of data, so we want to make sure we ping this endpoint only if we have to. This ensures we don’t pull performance graph data from Peloton we don’t need to and gives the Peloton API a break.

You can get workout data from the 

api/workout/{workoutId}/performance_graph
 endpoint and the 
api/workout/{workoutId}
 endpoint. You would think that the most detailed stats would be in the “performance graph,” but it turns out there is some data in 
api/workout/{workoutId}
 like leaderboard stats. So I created a 
workoutData
 object that contains “summary” and “performance” metrics.

Once we have all the relevant columns, we just format the data in a way that the Coda API needs and push that data to the Workouts table.

Python script

The Python script works pretty much the same way as the Google Apps Script, without the added benefit of being able to schedule the script to run at some interval in an easy way. Authentication, however, was much easier to accomplish with the Python script.

By importing the requests library, you get a user-friendly way to manage the logged-in session on Peloton. For instance, with these four lines of code, we can authenticate with Peloton so that for future calls to the API, we just need to use 

s.get()
 with various parameters:

s = requests.Session()
base_url = 'https://api.onepeloton.com'
payload = {'username_or_email': peloton_username, 'password': peloton_pw}
s.post(base_url + '/auth/login', json=payload)

There’s no messing around with cookies 🍪, it just works.

Deploying a serverless function on Google Cloud

You could run the script on your local machine or on some public cloud platform. The tradeoff for having a more difficult method for automating how often the script runs is the flexibility with where/how you run the script.

Serverless functions were all the rage the last few years so I thought I’d try it out and see if I could spin up an example on Google Cloud Platform. The goal: get a URL that we can ping to trigger the Python script to run.

Setting up Google Cloud

Just setting up Google Cloud to get one Cloud Function to run was a bit of a pain. In addition to setting up a billing account (requires a credit card) and tying a project to a billing account, you need to enable the Cloud Functions and Cloud Scheduler APIs (two services we need) to even start using Cloud Functions:

A helpful blog post I came across from a developer advocate at Google Cloud is this one. It’s a little harder to use since the blog post assumes you are using the 

gcloud
 command line tool. Nonetheless, Dustin creates a pattern for running the function that I wouldn’t have otherwise figured out (via Cloud Scheduler).

Setting up the Cloud Function

Once you start creating a Cloud Function, the key settings are to set the trigger type to “HTTP” and “Allow unauthenticated invocations.” I didn’t want to mess with IAM policies and all that stuff, so this should be fine for our needs:

Once you’re in the source code editor, you just need to set the runtime to “Python 3.7” and rename the 

Entry point
 to something like 
runPelotonSync
. Then you can copy over the Python script to the code editor.

In order for this script to work with Cloud Functions, however, you have to wrap the script inside a function like this. Almost all the code goes into the 

pelotonData(request)
 function:


After that, hit Deploy and wait for Google Cloud to deploy your function. If everything works out correctly, you’ll get a unique “Trigger URL” on the “Trigger” tab of your Cloud Function:

Get your Cloud Function to run every day

Unlike Google Apps Script where you can simply tell Google how often you want your script to run on a dropdown menu, we have tell Google Cloud how often the python script should run via cron rules. We can set up the interval for calling the URL we got from our Cloud Function by using Google Cloud Scheduler.

The key field to fill out when you set up a new Cloud Scheduler job is the 

URL
. This is the 
Trigger URL
 you got from your Cloud Function:

The 

Frequency
 is where you need the indicate the cron rules for how often you want Cloud Scheduler to ping the URL. In the above screenshot, this job would run every minute. A helpful site to figure out what characters you should put for the cron rule is https://crontab.guru/. Once this is all set up, you can get detailed logging on your job and see manually run the job from the main Cloud Scheduler interface:

Final notes

I’m still playing around with this template for visualizing my Peloton stats and with the data that gets returned from the Peloton API. If you have any suggestions or see mistakes with the scripts, feel free to submit a PR here.

Hope these stats encourage you to hit new PRs whether your cycling, running, or doing a strength exercise.

Train hard, train smart, and have fun! — Matt Welpers