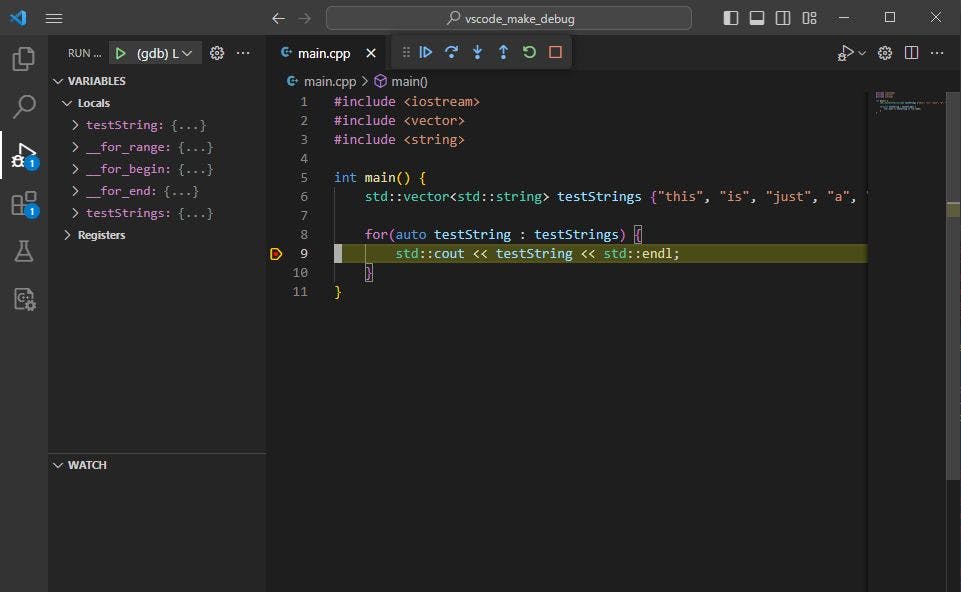
VSCode has some fantastic debugging features which allow code breaking and line-by-line stepping. I’ve worked with it using Java and Python in the past, however, it took more pre-configuration for me to get it set up for C++. In this tutorial, I will demonstrate how to set up for compiling and debugging C++ in a way that causes it to trigger a makefile target compilation each time. VSCode I will be using the following tools: VSCode Git Bash (using ) MinGW-w64 g++ (part of the (GCC)) GNU Compiler Collection GNU Make Using Git-bash Terminal Start by installing and if you haven’t already. VSCode Git Bash Open a new directory with VSCode, and push Ctrl-` or View→Terminal to open up a terminal. You may need to specify the default terminal: push Ctrl-Shift-P and search for “Terminal: Select Default Profile” select the git-bash as your default terminal (for me it was found at “C:\Program Files\Git\bin\bash.exe”). Installing g++, Make, and gdb within Git-Bash Git-bash uses MingW as its default environment. MingW provides a number of features and parts of the GCC library which may be used to compile your C++ programs. To start installing them: type to open the MingW installer /c/MinGW/bin/mingw-get.exe right click on each of the following items and select “mark for installation”: mingw32-gcc-g++, class “bin” mingw32-gdb, class “bin” mingw32-make, class “bin” On the top left corner select: Installation → Apply Changes → Apply Wait for the installation to complete and close the window. You should now be able to run each of these programs in git-bash by typing: /c/MinGW/bin/g++ /c/MinGW/bin/gdb /c/MinGW/bin/mingw32-make.exe so you’re not forced to type the entire path to those programs every time. Consider adding “C:\MinGW\bin” to your PATH variable Create a Simple C++ Program with Makefile Let’s start by just creating a simple C++ program that prints a list of strings. Create two new files: main.cpp #include <iostream> #include <vector> #include <string> int main() { std::vector<std::string> testStrings {"this", "is", "just", "a", "test"}; for(auto testString : testStrings) { std::cout << testString << std::endl; } } Makefile CC="/c/MinGW/bin/g++.exe" main.exe: main.cpp ${CC} -g main.cpp (notice I’ve included the ‘-g’ flag for g++, which enables debugging symbols for gdb later) Run the ‘main.exe’ make target, then run the executable to make sure everything works: $ /c/MinGW/bin/mingw32-make.exe main.exe $ ./main.exe Assuming the compilation was successful, you should see our list of strings printed off in the terminal: $ ./main.exe this is just a test Setting up VSCode debugger Open the “Run and Debug” side panel on the left side of the screen (Ctrl-Shift-D or View→Run) With "main.cpp” open, click “create a launch.json file” select “C++ (GDB/LLDB)” launch.json This will create a new file under .vscode/launch.json which allows us to add debugging configurations. Fill it with the following content: { "version": "0.2.0", "configurations": [ { "name": "(gdb) Launch", "type": "cppdbg", "request": "launch", "program": "${workspaceFolder}/main.exe", "args": [], "stopAtEntry": false, "cwd": "${fileDirname}", "environment": [], "externalConsole": false, "MIMode": "gdb", "miDebuggerPath": "C:\\MinGW\\bin\\gdb.exe", "setupCommands": [ { "description": "Enable pretty-printing for gdb", "text": "-enable-pretty-printing", "ignoreFailures": true }, { "description": "Set Disassembly Flavor to Intel", "text": "-gdb-set disassembly-flavor intel", "ignoreFailures": true } ], "preLaunchTask": "run the makefile" } ] } Ensure the path to gdb is correct under “miDebuggerPath”, and that the main executable of your program is specified under “program”. tasks.json The preLaunchTask in the launch.json references a task with the name “run the makefile” which we need to create now. Create new file called .vscode/tasks.json with the following content: { "tasks": [ { "type": "shell", "label": "run the makefile", "command": "/c/MinGW/bin/mingw32-make.exe", "args": ["main.exe"], "problemMatcher": [], } ], "version": "2.0.0" } (optional) test the build task You may ensure that tasks.json is properly formatted by trying it out directly: push Ctrl-Shift-P and select “Tasks: Run Task” select “run the makefile” This should automatically open up a terminal with the following text: * Executing task: /c/MinGW/bin/mingw32-make.exe main.exe mingw32-make: 'main.exe' is up to date. * Terminal will be reused by tasks, press any key to close it. You may delete main.exe and run the task again to ensure the compilation works correctly, but this is good enough for me for now. Running the debugger Push F5 or Run→”Start Debugging” which should automatically compile your program using make and run your program. Push Ctrl-Shift-Y or View→”Debug Console” to view the program output, which should look something like this: =thread-group-added,id="i1" GNU gdb (GDB) 7.6.1 Copyright (C) 2013 Free Software Foundation, Inc. License GPLv3+: GNU GPL version 3 or later <http://gnu.org/licenses/gpl.html> This is free software: you are free to change and redistribute it. There is NO WARRANTY, to the extent permitted by law. Type "show copying" and "show warranty" for details. This GDB was configured as "mingw32". For bug reporting instructions, please see: <http://www.gnu.org/software/gdb/bugs/>. Warning: Debuggee TargetArchitecture not detected, assuming x86_64. =cmd-param-changed,param="pagination",value="off" =cmd-param-changed,param="args",value="2>CON 1>CON <CON" [New Thread 18240.0x8db0] [New Thread 18240.0x81c] [New Thread 18240.0xa3e8] [New Thread 18240.0x8ea4] Loaded 'C:\WINDOWS\SysWOW64\kernel32.dll'. Symbols loaded. Loaded 'C:\WINDOWS\SysWOW64\KernelBase.dll'. Symbols loaded. Loaded 'C:\WINDOWS\SysWOW64\msvcrt.dll'. Symbols loaded. Loaded 'C:\MinGW\bin\libgcc_s_dw2-1.dll'. Symbols loaded. Loaded 'C:\MinGW\bin\libstdc++-6.dll'. Symbols loaded. this is just a test The program 'C:\path\to\main.exe' has exited with code 0 (0x00000000). The strings have been printed out, which is a good sign. Debugging Consider clicking on line 9 to set a breakpoint in the middle of the for loop and run the debugger again, then push F10 to step one line at a time of program execution. to find out more about the usage of the VSCode debugger. Click here