
230 reads
Goodbye Manual Monitoring: How AIOps Spots Problems Before You Do
by byKyrylo Polishchuk@kirponik
DevOps Engineer with over 10 years of experience in IT. Proven leadership and operational excellence
October 22nd, 2025


DevOps Engineer with over 10 years of experience in IT. Proven leadership and operational excellence


DevOps Engineer with over 10 years of experience in IT. Proven leadership and operational excellence
About Author

DevOps Engineer with over 10 years of experience in IT. Proven leadership and operational excellence
Comments

TOPICS


Related Stories


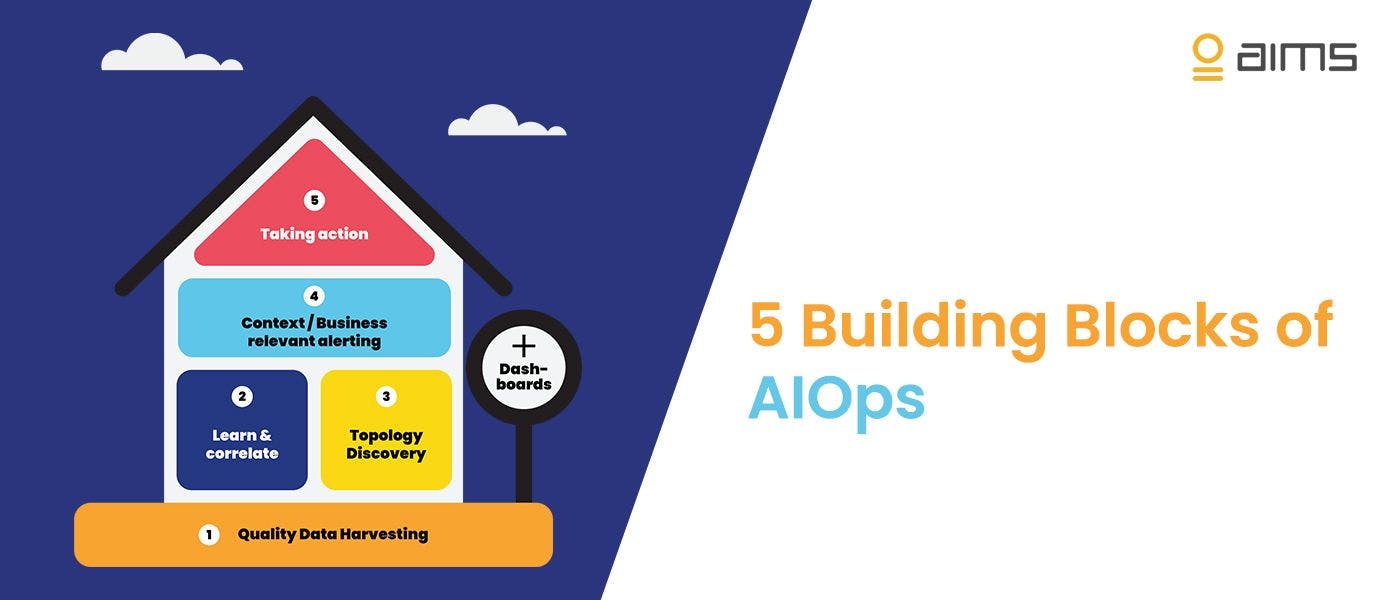
5 Building Blocks of AIOps

Feb 14, 2022


5 Building Blocks of AIOps
Feb 14, 2022