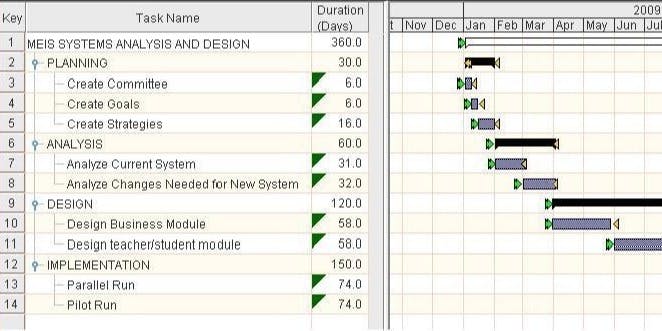
Too Long; Didn't Read
A Gantt chart provides you with a visual presentation of what needs to be done and when exactly and helps you to track the progress at all stages of a project. This function is available in many project management apps, like [GanttPRO] or [DHTMLX GantT] Charts are commonly used in project management, because it helps to understand hurdles to make critical decisions and find the best way to move forward. A chart shows those who are deeply involved in the process as well as those who have less participation and gives a clear view on changes that are happening in the chart. It also simplifies an intricate set of tasks that your team has to set and give a simple and simple view on all