Discover Anything
Hackernoon
Login
Signup
Write
↫
To Gallery
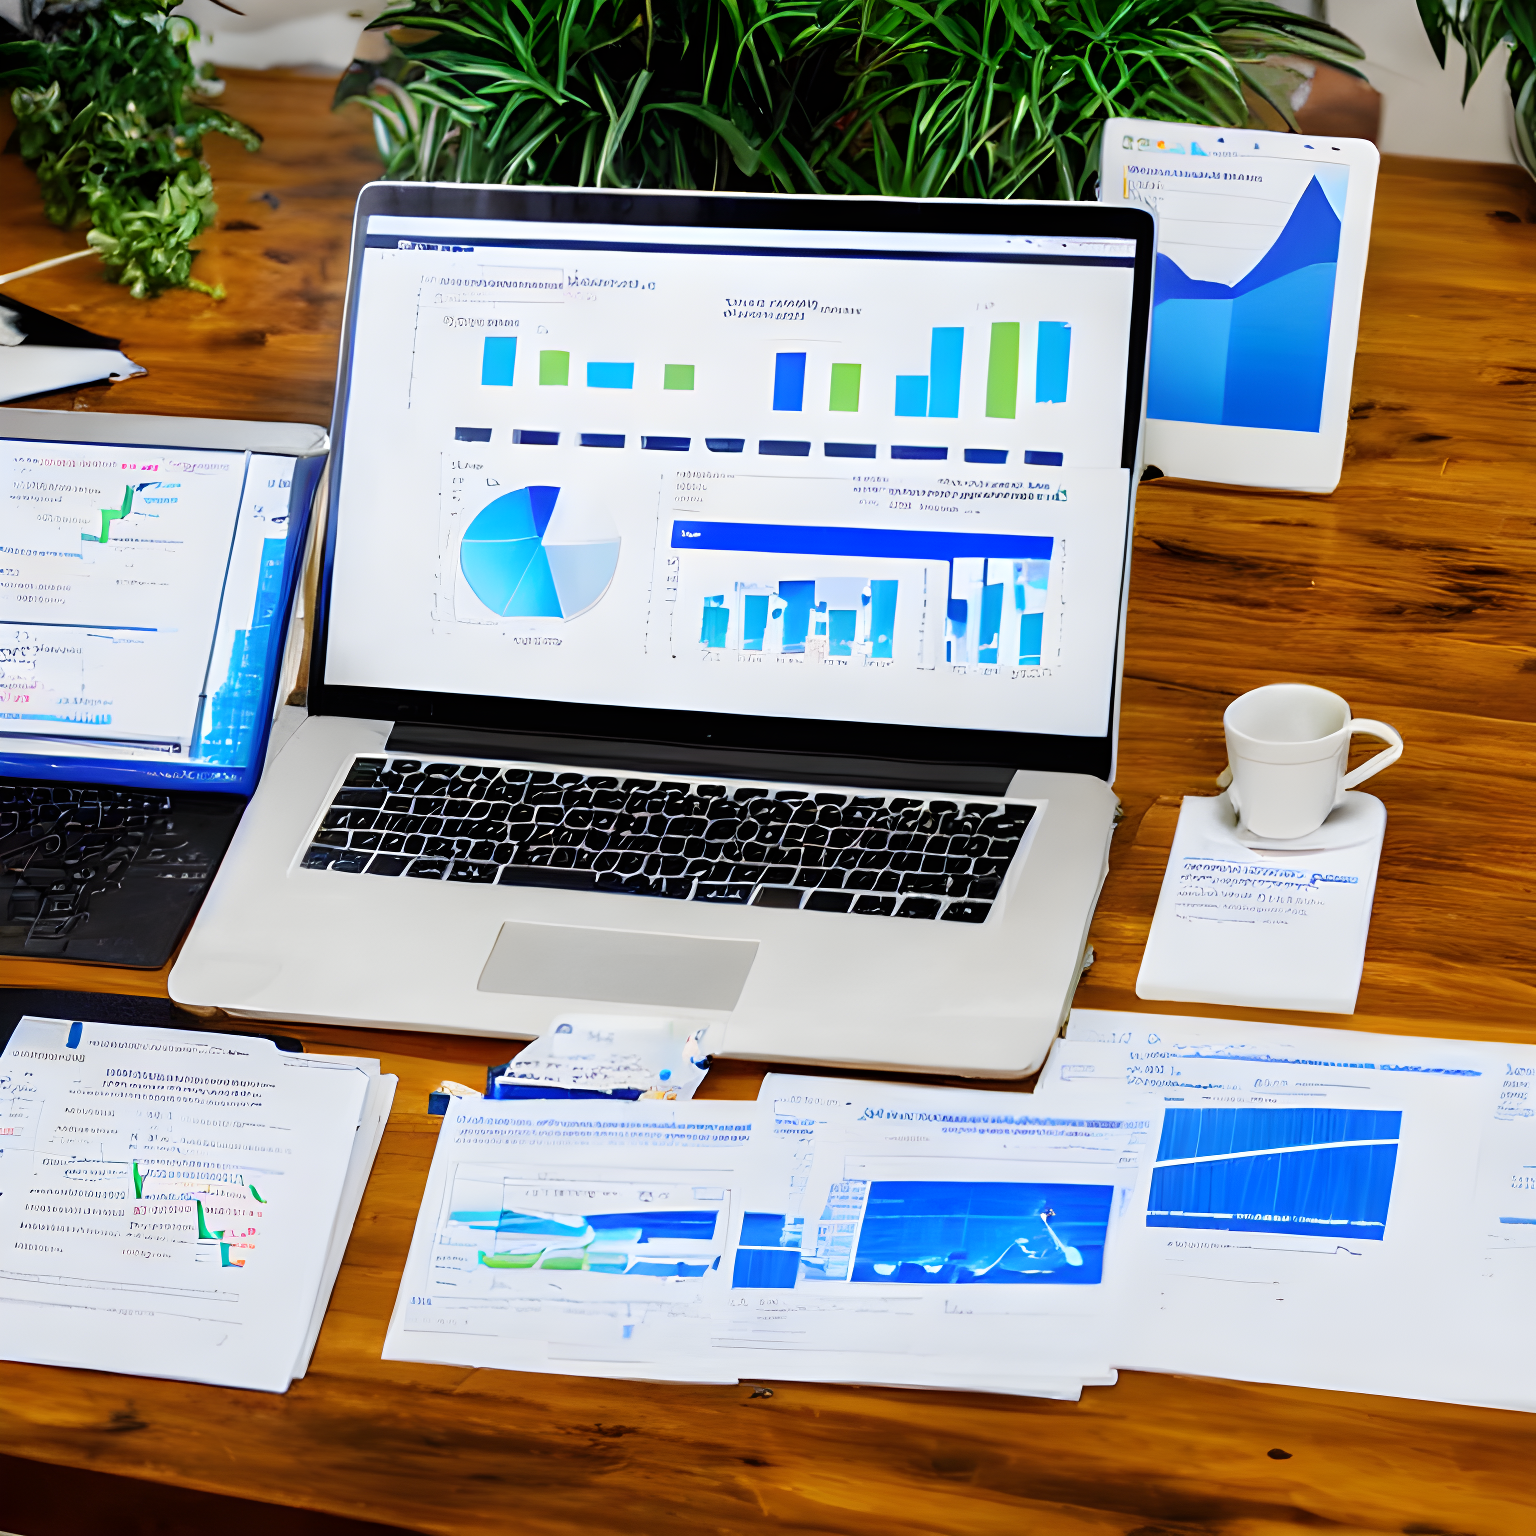
"data graphs and models"
Model
Stable Diffusion 2.1
Stories
How to Use Tableau Visualization to Make a Covid Risk Model
Created By
@joseh
3 years ago
These images are free to use with accreditation. COPY & PASTE accreditation
Trending Topics
blockchain
cryptocurrency
hackernoon-top-story
programming
software-development
technology
startup
hackernoon-books
Bitcoin
books
Search by
Login
SignUp
Light-Mode
Classic
Newspaper
Minty
Dark-Mode
Neon Noir
Minty
HN StartUps


