paint-brush
Four Types of Array Data-Based Bar Charts in Pythonby@luca1iu
103 reads

Four Types of Array Data-Based Bar Charts in Python

by Luca Liu2mMarch 13th, 2024
Read on Terminal Reader
Read this story w/o Javascript
tldt arrow

Too Long; Didn't Read

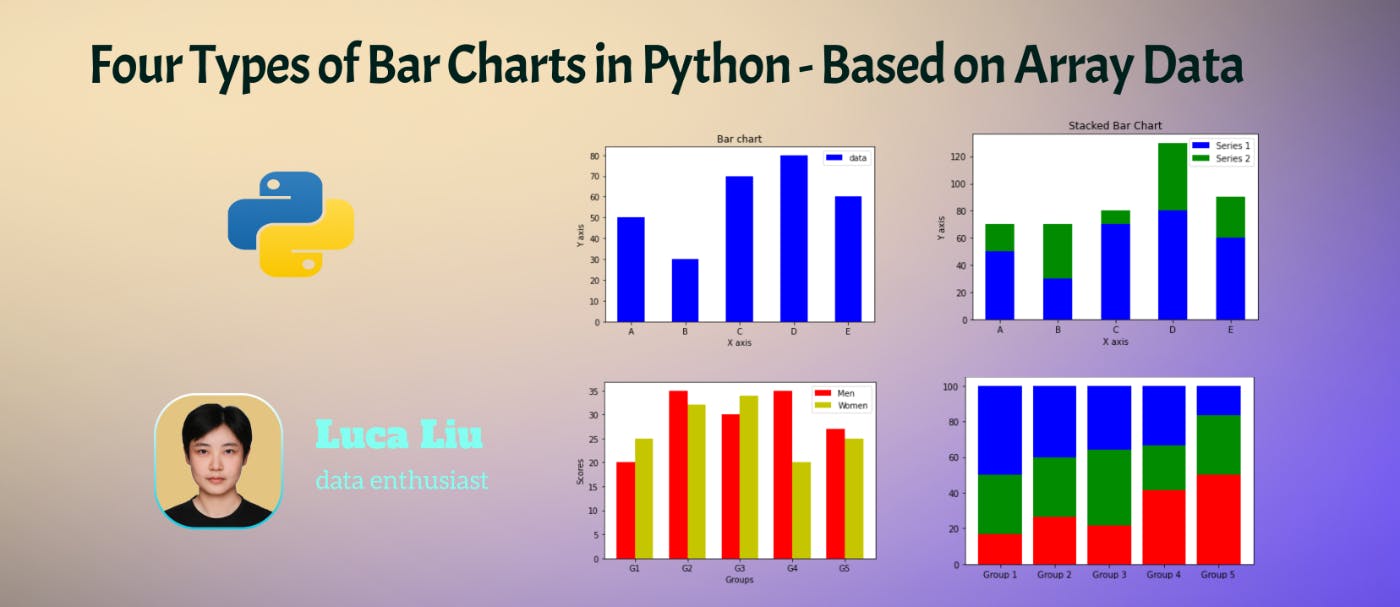
import matplotlib.pyplot as plt, numpy as numpy, data as data. Data.Data (men, women, men, women) = 5. Data (men) = (20, 35, 30, 35), women_means = (25, 32, 34, 20, 25) x-axis position = 0.35, y-axisposition = 1, width of each bar at 0.5, height of each axis at 1.5. Y-axis height = 1.
featured image - Four Types of Array Data-Based Bar Charts in Python
Luca Liu HackerNoon profile picture
Luca Liu

Luca Liu

@luca1iu

a Business Intelligence Developer with a passion for all things data

0-item

STORY’S CREDIBILITY

Guide

Guide

Walkthroughs, tutorials, guides, and tips. This story will teach you how to do something new or how to do something better.

L O A D I N G
. . . comments & more!

About Author

Luca Liu HackerNoon profile picture
Luca Liu@luca1iu
a Business Intelligence Developer with a passion for all things data

TOPICS

THIS ARTICLE WAS FEATURED IN...

Permanent on Arweave
Read on Terminal Reader
Read this story in a terminal
 Terminal
Read this story w/o Javascript
 Lite