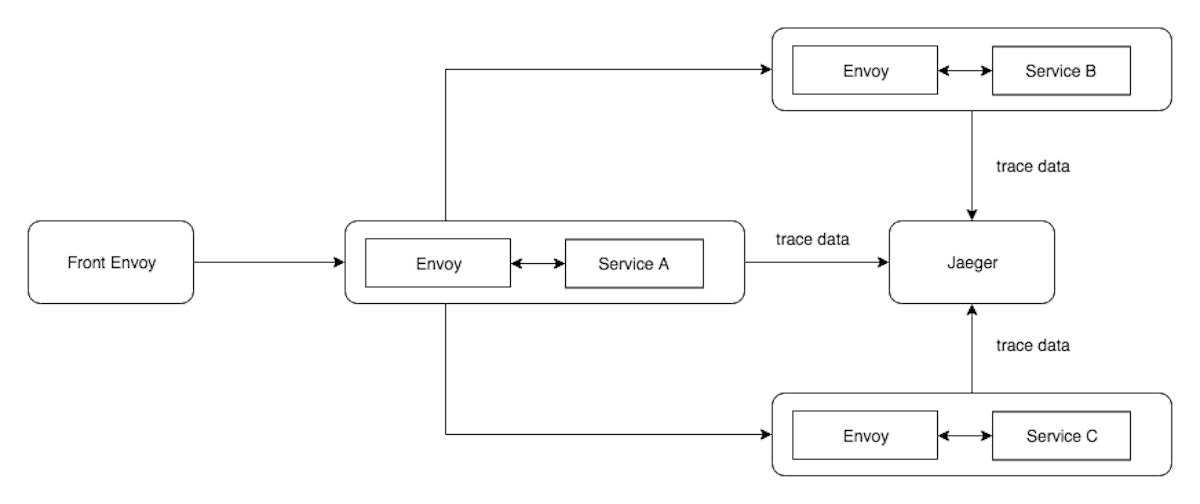
If you are new to “Service Mesh” and “Envoy”, i have a post explaining both of them . here With a micro-services architecture, observability becomes highly important. I would say it is one of the pre-requisite if you even want to take that route. One of my ex-colleagues has made an awesome list of requirements you need to meet if you want to do micro services . here Well you have many things under observability Monitoring Alerting Centralised Logging Distributed Tracing This post will discuss only about Distributed Tracing in the context of Envoy service mesh and i am trying to give an overall picture of how distributed tracing, OpenTracing, Envoy service mesh and Jaeger fit together. In the we will discuss about monitoring with Envoy service mesh, prometheus & grafana. next post Distributed Tracing With many number of services and requests flowing to and fro, you need the ability to quickly find out what went wrong and exactly where. Distributed tracing was popularised by . It is essentially the ability to trace a request throughout it’s life cycle within the micro services. Google’s Dapper So the easiest way to do it would be to generate a unique request id (x-request-id) at the front-proxy and propagate that request id to all the services the request interacts with. You could basically append the unique request id to all the log messages. So if you search for the unique id in a system like kibana, you will get to see logs from all the services for that particular request. It is very helpful, but this wouldn’t tell you in which order the requests were done, which requests were done in parallel or the time consumed by each service. Let us see how OpenTracing and Envoy service mesh can help us. OpenTracing Instead of passing around just a single id (x-request-id), if we could pass around more data like which service is at the root level of the request, which service is the child of which service, etc… we could figure out all the answers. And the standard way of doing this is OpenTracing. It is a language neutral specification for distributed tracing. You can read more about the specification . here Envoy Service Mesh A service mesh is like a communication layer for micro services. All the communication between the services happens through the mesh. It helps with load balancing, service discovery, traffic shifting, rate limiting, metrics collection, etc… is one such service mesh framework. In our case envoy is going to help us with generating the root unique request id (x-request-id), generating child request id’s and sending them to a tracing system like or which stores, aggregates and has a view layer for the traces. Envoy Jaeger Zipkin In this post we will be using Jaeger as our tracing system. Envoy can generate tracing data based on zipkin’s format or lighstep’s format. We will use Zipkin’s standard and it is compatible with Jaeger. Just show me the code already… The following diagram shows an overview of what we are trying to build Service setup We are going to use docker-compose for this setup. You need to supply Envoy with a configuration file. Am not going to explain how to configure envoy. We will concentrate on the parts which are relevant to tracing. You can find more about configuring envoy . here Front Envoy The role of the Front Envoy is to generate the root request id and you can configure envoy to generate it. Here is the configuration file for Front Envoy lines 1–8 enables tracing and configures the tracing system and the place where the tracing system lives. lines 27–28 specify where this is an outgoing or incoming traffic. line 38 mentions that envoy has to generate the root request id. line 66–73 configures the Jaeger tracing system. Enabling the tracing and configuring Jaeger address will be present in all the envoy configurations (front, service a, b &c) Service A In our setup Service A is going to call Service B and Service C. The very important thing about distributed tracing is, even though Envoy supports and helps you with distributed tracing, . So our Service A will forward the request tracing headers while calling Service B and Service C. Service A is a simple go service with just one end point that calls Service B and Service C internally. These are the headers that we need to pass it is upto the services to forward the generated headers to outgoing requests You might wonder why the url is service_a_envoy while calling Service B. If you remember we already discussed that all the communication between the services will need to go through envoy proxy. So similarly you can pass the headers while calling Service C. Service B & Service C The remaining two services need not specifically do any changes in the code since they are at the leaf level. In case these two service are going to call some other endpoint then you will have to forward the request tracing headers. And no special configurations for Envoy as well. Service B & C would look like this So with all of this done, if you run docker-compose up and hit the Front Envoy endpoint, trace information would have been generated and pushed to Jaeger. Jaeger has a very nice to UI to visualise the traces and the trace for our setup will look like this trace from Jaeger As you can see it provides the overall time taken, time taken in each part of the system, which service is calling which service, service to service relationship (service b and service c are siblings). Ill leave it to you to explore Jaeger. You can find all the envoy configurations, code and docker compose file here _Demo for distributed tracing with envoy, zipkin|jaeger & open tracing - dnivra26/envoy_distributed_tracing_github.com dnivra26/envoy_distributed_tracing Thats it folks. Thanks. Please let me know your feedback. If you are looking for an Envoy xDS server, my colleague has built . Do check it out. one is the next article(Monitoring with Envoy, Prometheus & Grafana) in series. Here