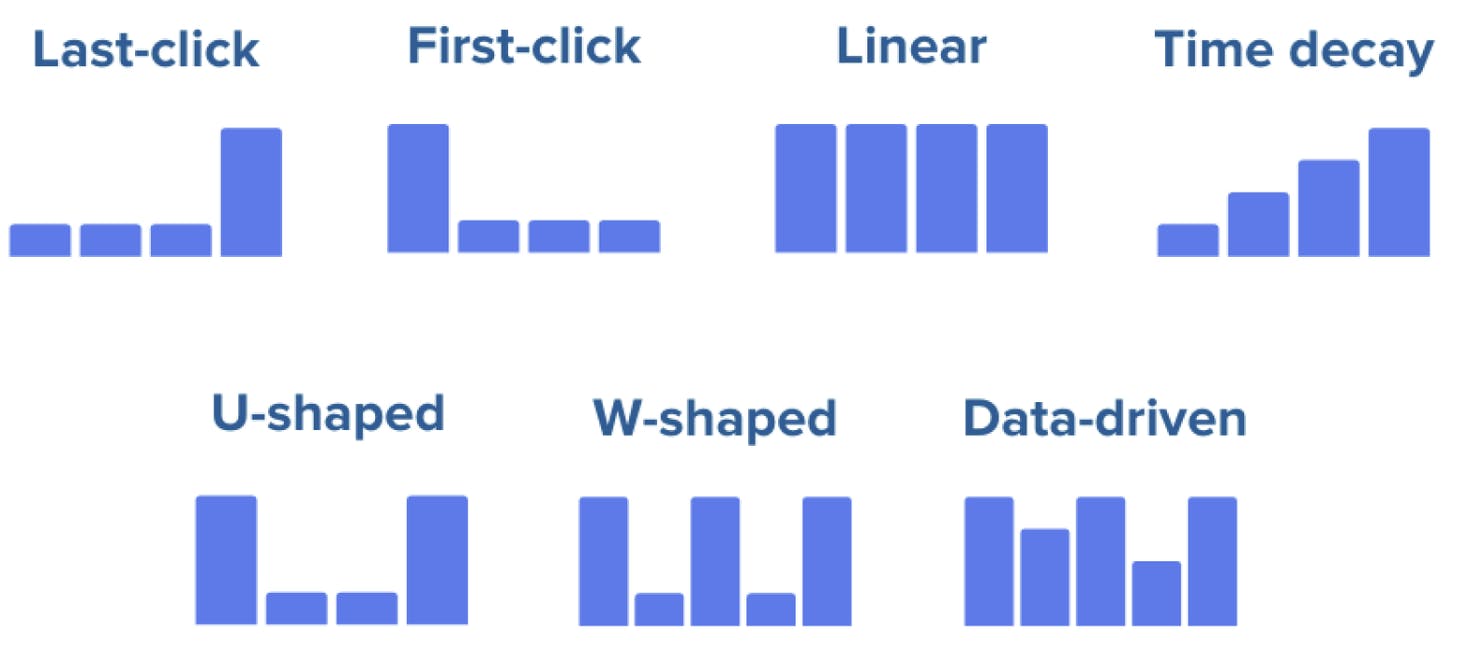
Attribution models play a critical role in the digital marketing and ecommerce world by helping us understand user journeys and make data driven decisions. In this article, we will dive into the definitions, use cases, and implementation of 7 different attribution models using BigQuery. 🚀 I work at a leading e-commerce company that has over 3 million distinct users daily. With such a vast user base, the platform consists of numerous components and pages, including banners, recommendation widgets, flash deals, and search results. Each of these elements plays a unique role in guiding users along their journey toward a purchase. Managing and evaluating the effectiveness of these components at scale is a significant challnge, but it is crucial for optimizing user experiences and driving business growth. In digital marketing, the customer journey consists of multiple touchpoints, each contributing differently to the conversion process. Accurately evaluating these touchpoints is key to making more efficient use of marketing budgets. Attribution models are the methods used to carry out this evaluation, and each model provides a unique perspective on user behavior. Why Attribution Models Are Significantly Better? The following visual summarizes the impact of different components (e.g., "Swimlane," "Horizontal Banner," "Deal of the Day") on the purchase journeys of four different users in an e-commerce platform. The visual analyzes each component in terms of views, clicks, and orders, providing valuable insights into their role at various stages of the customer journey. By understanding these metrics in the context of millions of daily users and hundreds of components, businesses can evaluate which elements capture user attention, drive engagement, and ultimately lead to conversions. This makes attribution models an indispensable tool for data driven decision making at scale. What Advantages Do These Models Provide? Enhancing Customer Experience Identifying the correct sources allows us to gain a deeper understanding of customer behaviors and preferences. This insight enables us to deliver more targeted and personalized services, creating a more engaging and satisfying user experience. Prioritizing In App Feature Development Attribution data reveals which features are effective and which areas require improvement. For example, if we notice that users coming from a specific page have higher purchase rates, we can focus on optimizing the design or placement of that page to maximize its potential. Reporting and Transparency Accurately reporting the performance of each source empowers teams to make more informed, data-driven decisions. Additionally, when all teams work with the same data, collaboration and alignment across departments improve significantly. Standardization and Consistency Using a single attribution model for all features ensures that the data is more consistent and reliable. This standardization fosters seamless collaboration across different teams and provides a unified understanding of performance metrics. A/B Testing and Experimentation Attribution models play a crucial role in accurately measuring the impact of A/B tests. They help determine which variation is more effective in driving conversions. Moreover, they reveal shifts in the share of orders across sources, even when overall transactional metrics remain unchanged, providing deeper insights into test outcomes. Attribution Modelleri ve Mantıkları Which User Behavior Should We Focus On? 🧐 Users with only a single interaction (highlighted in orange) will give the same result across all attribution models, so they’re not our priority. Instead, we’ll focus on users with multiple interactions but only one order. Our goal is to figure out which component had the biggest influence on their purchase. This way, we can uncover more meaningful insights and make smarter optimizations. The White Colored User’s Journey 👩🏻💻 The user highlighted in white has interacted with 4 different components and clicked on 3 of them in the following order: Brand Widget Deal of the Day Reco Boxes On the same day, this user made a single purchase. Using various attribution models, we’ll identify which component triggered the order and how the credit should be distributed among these interactions. This will give us a clearer understanding of the components’ influence on the user’s decision. 1. First Touch Model (Interaction, Visit, Campaign etc.) This model assigns all credit to the first touchpoint in the user’s journey and is commonly used to measure the effectiveness of acquisition campaigns. Its key benefit lies in identifying the channel that first introduced the user to the brand. This makes it particularly valuable for strategies focused on acquiring new customers. BigQuery: SELECT user_id, MIN(timestamp) AS first_touch_time, FIRST_VALUE(component) OVER (PARTITION BY user_id ORDER BY timestamp) AS first_touch_component FROM `project.dataset.user_journey` GROUP BY ALL; User Info First Interation Credit White Colored User Brand Widget 100% The first_touch_component indicates the channel where the conversion journey began, providing insights into which source initially captured the user’s attention. 2. Last Touch Model (Interaction, Visit, Campaign etc.) This model assigns all credit to the last touchpoint in the user’s journey, emphasizing the importance of the interaction closest to the conversion. Its main advantage is enabling the analysis of the component that had the most direct impact on driving the conversion. This makes it especially useful for optimization. BigQuery: SELECT user_id, MAX(timestamp) AS last_touch_time, LAST_VALUE(component) OVER (PARTITION BY user_id ORDER BY timestamp ROWS BETWEEN UNBOUNDED PRECEDING AND UNBOUNDED FOLLOWING) AS last_touch_channel FROM `project.dataset.user_journey` GROUP BY ALL; User Info Last Interation Credit White Colored User Reco Boxes 100% It highlights the component that directly influenced the user's decision to convert, providing valuable insights into the most impactful touchpoint in the journey. 3. Linear Model The linear model assigns equal credit to every touchpoint in the user journey, making it ideal for situations where all interactions are considered equally important. Its key advantage is treating all component fairly, acknowledging their equal contribution to the conversion. This model is particularly suitable for complex customer journeys, where multiple touchpoints play a role in influencing the user’s decision. With this approach, there is no distinction between the user’s first click and their last click, as every touchpoint receives the same weight in the credit distribution. BigQuery: SELECT user_id, channel, COUNT(component) AS touch_count, (1.0 / COUNT(component)) AS linear_credit FROM `project.dataset.user_journey` GROUP BY All; User Info All Interation Credit White Colored User Brand Widget 33% White Colored User Deal of The Day 33% White Colored User Reco Boxes 33% It ensures that every interaction in the user journey is valued equally, providing a balanced view of all touchpoints' impact. 4. Time Decay Model The time decay model assigns decreasing weights to touchpoints as time progresses, giving more importance to interactions closer to the conversion. This model is particularly effective in scenarios involving quick decision making processes, where recent touchpoints are more influential. Its key benefit is the ability to better analyze the impact of recent component/page efforts, highlighting their critical role in driving conversions. BigQuery: WITH weighted_data AS ( SELECT user_id, component, TIMESTAMP_DIFF(MAX(timestamp), timestamp, SECOND) AS time_diff, EXP(-time_diff / 86400) AS time_decay_weight FROM `project.dataset.user_journey` GROUP BY ALL ) SELECT user_id, component, SUM(time_decay_weight) AS total_weight FROM weighted_data GROUP BY All; User Info All Interation Credit White Colored User Brand Widget 20% White Colored User Deal of The Day 30% White Colored User Reco Boxes 50% It highlights the importance of recent interactions, providing a dynamic view of how proximity to the conversion impacts the effectiveness of each touchpoint. 5. U-Shape Model This model gives greater weight to the first and last touchpoints, while assigning less credit to the interactions in between. This model emphasizes the importance of the components that initially introduced the user to the brand and those that finalized the conversion. Intermediate touchpoints, while still contributing, are considered less impactful as they primarily keep the user engaged throughout the journey. BigQuery: WITH touch_points AS ( SELECT user_id, component, ROW_NUMBER() OVER (PARTITION BY user_id ORDER BY timestamp) AS touch_order, COUNT(*) OVER (PARTITION BY user_id) AS total_touches FROM `project.dataset.user_journey` ) SELECT user_id, channel, CASE WHEN touch_order = 1 THEN 0.4 WHEN touch_order = total_touches THEN 0.4 ELSE 0.2 / (total_touches - 2) END AS u_shape_credit FROM touch_points; User Info All Interation Credit White Colored User Brand Widget 40% White Colored User Deal of The Day 20% White Colored User Reco Boxes 40% Benefits: Highlights the most critical moments in the user journey (beginning and end). Optimizes coordination between components by identifying key contributors. Provides clear insights, especially for complex customer journeys. 6. W-Shape Model This model assigns greater credit to the first touchpoint, last touchpoint, and the most critical intermediate touchpoint right before the conversion. This model emphasizes multiple key moments in the user journey, providing a more balanced and comprehensive analysis of the interactions that drive conversions. BigQuery: WITH touch_points AS ( SELECT user_id, component, ROW_NUMBER() OVER (PARTITION BY user_id ORDER BY timestamp) AS touch_order, COUNT(*) OVER (PARTITION BY user_id) AS total_touches FROM `project.dataset.user_journey` ) SELECT user_id, component, CASE WHEN touch_order = 1 THEN 0.3 WHEN touch_order = total_touches THEN 0.3 WHEN touch_order = ROUND(total_touches / 2) THEN 0.3 ELSE 0.1 / (total_touches - 3) END AS w_shape_credit FROM touch_points; User Info All Interation Credit White Colored User Brand Widget 40% White Colored User Deal of The Day 20% White Colored User Reco Boxes 40% Benefits: Evaluates not only the first and last touchpoints but also other critical moments in the conversion journey. Ideal for identifying key interactions that play a significant role in driving conversions. The Key Difference Between U-Shape and W-Shape Models The primary distinction between the U-Shape and W-Shape models lies in the weight assigned to intermediate components. While the U-Shape model distributes credit equally among all interactions between the first and last touchpoints, the W-Shape model assigns higher credit to intermediate interactions that are closer to the final touchpoint. You can compare these two models using the example below to better understand how credit distribution differs in scenarios with multiple touchpoints. 7. Data-Driven Model The data driven model leverages machine learning and data-driven algorithms to optimize credit allocation. By analyzing user behavior, this model learns the impact of each intraction on conversions, providing a dynamic and highly accurate understanding of touchpoint contributions. BigQuery: CREATE MODEL `project.dataset.attribution_model`OPTIONS(model_type='logistic_reg') AS SELECT * FROM `project.dataset.user_journey_training_data`; SELECT user_id, predicted_attribution FROM ML.PREDICT(MODEL `project.dataset.attribution_model`, (SELECT * FROM `project.dataset.user_journey_test_data`)); User Info All Interation Credit White Colored User Brand Widget 10% White Colored User Deal of The Day 30% White Colored User Reco Boxes 60% Benefits: Provides dynamic and personalized analysis tailored to user behavior. Well-suited for working with large datasets, ensuring accurate insights at scale. Conclusion Working on our order attribution model has been an amazing experience at our company. It’s helped us understand how users interact with our platform and what drives their decisions. We’ve seen big benefits, from better team decisions to more useful insights. If you haven’t tried attribution modeling yet, I highly recommend it. Start small, focus on key touchpoints, and let the data show you the way. For us, it’s been a game changer, and we’re excited to keep improving it to make the user experience even better. Thank you for your time; sharing is caring! 🌍 Attribution models play a critical role in the digital marketing and ecommerce world by helping us understand user journeys and make data driven decisions. In this article, we will dive into the definitions, use cases, and implementation of 7 different attribution models using BigQuery. 🚀 I work at a leading e-commerce company that has over 3 million distinct users daily . With such a vast user base, the platform consists of numerous components and pages, including banners, recommendation widgets, flash deals, and search results. Each of these elements plays a unique role in guiding users along their journey toward a purchase. Managing and evaluating the effectiveness of these components at scale is a significant challnge, but it is crucial for optimizing user experiences and driving business growth. 3 million distinct users daily In digital marketing, the customer journey consists of multiple touchpoints, each contributing differently to the conversion process. Accurately evaluating these touchpoints is key to making more efficient use of marketing budgets. Attribution models are the methods used to carry out this evaluation, and each model provides a unique perspective on user behavior. Why Attribution Models Are Significantly Better? Why Attribution Models Are Significantly Better? The following visual summarizes the impact of different components (e.g., "Swimlane," "Horizontal Banner," "Deal of the Day") on the purchase journeys of four different users in an e-commerce platform. The visual analyzes each component in terms of views, clicks, and orders, providing valuable insights into their role at various stages of the customer journey. By understanding these metrics in the context of millions of daily users and hundreds of components, businesses can evaluate which elements capture user attention, drive engagement, and ultimately lead to conversions. This makes attribution models an indispensable tool for data driven decision making at scale. What Advantages Do These Models Provide? What Advantages Do These Models Provide? Enhancing Customer Experience Identifying the correct sources allows us to gain a deeper understanding of customer behaviors and preferences. This insight enables us to deliver more targeted and personalized services, creating a more engaging and satisfying user experience. Prioritizing In App Feature Development Attribution data reveals which features are effective and which areas require improvement. For example, if we notice that users coming from a specific page have higher purchase rates, we can focus on optimizing the design or placement of that page to maximize its potential. Reporting and Transparency Accurately reporting the performance of each source empowers teams to make more informed, data-driven decisions. Additionally, when all teams work with the same data, collaboration and alignment across departments improve significantly. Standardization and Consistency Using a single attribution model for all features ensures that the data is more consistent and reliable. This standardization fosters seamless collaboration across different teams and provides a unified understanding of performance metrics. A/B Testing and Experimentation Attribution models play a crucial role in accurately measuring the impact of A/B tests. They help determine which variation is more effective in driving conversions. Moreover, they reveal shifts in the share of orders across sources, even when overall transactional metrics remain unchanged, providing deeper insights into test outcomes. Enhancing Customer Experience Identifying the correct sources allows us to gain a deeper understanding of customer behaviors and preferences. This insight enables us to deliver more targeted and personalized services, creating a more engaging and satisfying user experience. Enhancing Customer Experience Enhancing Customer Experience Identifying the correct sources allows us to gain a deeper understanding of customer behaviors and preferences. This insight enables us to deliver more targeted and personalized services, creating a more engaging and satisfying user experience. Prioritizing In App Feature Development Attribution data reveals which features are effective and which areas require improvement. For example, if we notice that users coming from a specific page have higher purchase rates, we can focus on optimizing the design or placement of that page to maximize its potential. Prioritizing In App Feature Development Prioritizing In App Feature Development Attribution data reveals which features are effective and which areas require improvement. For example, if we notice that users coming from a specific page have higher purchase rates, we can focus on optimizing the design or placement of that page to maximize its potential. Reporting and Transparency Accurately reporting the performance of each source empowers teams to make more informed, data-driven decisions. Additionally, when all teams work with the same data, collaboration and alignment across departments improve significantly. Reporting and Transparency Reporting and Transparency Accurately reporting the performance of each source empowers teams to make more informed, data-driven decisions. Additionally, when all teams work with the same data, collaboration and alignment across departments improve significantly. Standardization and Consistency Using a single attribution model for all features ensures that the data is more consistent and reliable. This standardization fosters seamless collaboration across different teams and provides a unified understanding of performance metrics. Standardization and Consistency Standardization and Consistency Using a single attribution model for all features ensures that the data is more consistent and reliable. This standardization fosters seamless collaboration across different teams and provides a unified understanding of performance metrics. A/B Testing and Experimentation Attribution models play a crucial role in accurately measuring the impact of A/B tests. They help determine which variation is more effective in driving conversions. Moreover, they reveal shifts in the share of orders across sources, even when overall transactional metrics remain unchanged, providing deeper insights into test outcomes. A/B Testing and Experimentation A/B Testing and Experimentation Attribution models play a crucial role in accurately measuring the impact of A/B tests. They help determine which variation is more effective in driving conversions. Moreover, they reveal shifts in the share of orders across sources, even when overall transactional metrics remain unchanged, providing deeper insights into test outcomes. Attribution Modelleri ve Mantıkları Which User Behavior Should We Focus On? 🧐 Which User Behavior Should We Focus On? 🧐 Users with only a single interaction (highlighted in orange ) will give the same result across all attribution models, so they’re not our priority. Instead, we’ll focus on users with multiple interactions but only one order . orange multiple interactions order Our goal is to figure out which component had the biggest influence on their purchase. This way, we can uncover more meaningful insights and make smarter optimizations. The White Colored User’s Journey 👩🏻💻 The White Colored User’s Journey 👩🏻💻 The user highlighted in white has interacted with 4 different components and clicked on 3 of them in the following order: white 4 different components 3 of them Brand Widget Deal of the Day Reco Boxes Brand Widget Brand Widget Deal of the Day Deal of the Day Reco Boxes Reco Boxes On the same day, this user made a single purchase . Using various attribution models, we’ll identify which component triggered the order and how the credit should be distributed among these interactions. This will give us a clearer understanding of the components’ influence on the user’s decision. purchase 1. First Touch Model (Interaction, Visit, Campaign etc.) This model assigns all credit to the first touchpoint in the user’s journey and is commonly used to measure the effectiveness of acquisition campaigns. Its key benefit lies in identifying the channel that first introduced the user to the brand. This makes it particularly valuable for strategies focused on acquiring new customers. first touchpoint BigQuery: SELECT user_id, MIN(timestamp) AS first_touch_time, FIRST_VALUE(component) OVER (PARTITION BY user_id ORDER BY timestamp) AS first_touch_component FROM `project.dataset.user_journey` GROUP BY ALL; SELECT user_id, MIN(timestamp) AS first_touch_time, FIRST_VALUE(component) OVER (PARTITION BY user_id ORDER BY timestamp) AS first_touch_component FROM `project.dataset.user_journey` GROUP BY ALL; User Info First Interation Credit White Colored User Brand Widget 100% User Info First Interation Credit White Colored User Brand Widget 100% User Info First Interation Credit User Info User Info First Interation First Interation Credit Credit White Colored User Brand Widget 100% White Colored User White Colored User Brand Widget Brand Widget 100% 100% The first_touch_component indicates the channel where the conversion journey began, providing insights into which source initially captured the user’s attention. first_touch_component 2. Last Touch Model (Interaction, Visit, Campaign etc.) This model assigns all credit to the last touchpoint in the user’s journey, emphasizing the importance of the interaction closest to the conversion. Its main advantage is enabling the analysis of the component that had the most direct impact on driving the conversion. This makes it especially useful for optimization . last touchpoint optimization BigQuery: SELECT user_id, MAX(timestamp) AS last_touch_time, LAST_VALUE(component) OVER (PARTITION BY user_id ORDER BY timestamp ROWS BETWEEN UNBOUNDED PRECEDING AND UNBOUNDED FOLLOWING) AS last_touch_channel FROM `project.dataset.user_journey` GROUP BY ALL; SELECT user_id, MAX(timestamp) AS last_touch_time, LAST_VALUE(component) OVER (PARTITION BY user_id ORDER BY timestamp ROWS BETWEEN UNBOUNDED PRECEDING AND UNBOUNDED FOLLOWING) AS last_touch_channel FROM `project.dataset.user_journey` GROUP BY ALL; User Info Last Interation Credit White Colored User Reco Boxes 100% User Info Last Interation Credit White Colored User Reco Boxes 100% User Info Last Interation Credit User Info User Info Last Interation Last Interation Credit Credit White Colored User Reco Boxes 100% White Colored User White Colored User Reco Boxes Reco Boxes 100% 100% It highlights the component that directly influenced the user's decision to convert, providing valuable insights into the most impactful touchpoint in the journey. 3. Linear Model The linear model assigns equal credit to every touchpoint in the user journey, making it ideal for situations where all interactions are considered equally important. Its key advantage is treating all component fairly, acknowledging their equal contribution to the conversion. This model is particularly suitable for complex customer journeys , where multiple touchpoints play a role in influencing the user’s decision. complex customer journeys With this approach, there is no distinction between the user’s first click and their last click , as every touchpoint receives the same weight in the credit distribution. first click last click BigQuery: SELECT user_id, channel, COUNT(component) AS touch_count, (1.0 / COUNT(component)) AS linear_credit FROM `project.dataset.user_journey` GROUP BY All; SELECT user_id, channel, COUNT(component) AS touch_count, (1.0 / COUNT(component)) AS linear_credit FROM `project.dataset.user_journey` GROUP BY All; User Info All Interation Credit White Colored User Brand Widget 33% White Colored User Deal of The Day 33% White Colored User Reco Boxes 33% User Info All Interation Credit White Colored User Brand Widget 33% White Colored User Deal of The Day 33% White Colored User Reco Boxes 33% User Info All Interation Credit User Info User Info All Interation All Interation Credit Credit White Colored User Brand Widget 33% White Colored User White Colored User Brand Widget Brand Widget 33% 33% White Colored User Deal of The Day 33% White Colored User White Colored User Deal of The Day Deal of The Day 33% 33% White Colored User Reco Boxes 33% White Colored User White Colored User Reco Boxes Reco Boxes 33% 33% It ensures that every interaction in the user journey is valued equally, providing a balanced view of all touchpoints' impact. 4. Time Decay Model The time decay model assigns decreasing weights to touchpoints as time progresses, giving more importance to interactions closer to the conversion. This model is particularly effective in scenarios involving quick decision making processes , where recent touchpoints are more influential. quick decision making processes Its key benefit is the ability to better analyze the impact of recent component/page efforts , highlighting their critical role in driving conversions. recent component/page efforts BigQuery: WITH weighted_data AS ( SELECT user_id, component, TIMESTAMP_DIFF(MAX(timestamp), timestamp, SECOND) AS time_diff, EXP(-time_diff / 86400) AS time_decay_weight FROM `project.dataset.user_journey` GROUP BY ALL ) SELECT user_id, component, SUM(time_decay_weight) AS total_weight FROM weighted_data GROUP BY All; WITH weighted_data AS ( SELECT user_id, component, TIMESTAMP_DIFF(MAX(timestamp), timestamp, SECOND) AS time_diff, EXP(-time_diff / 86400) AS time_decay_weight FROM `project.dataset.user_journey` GROUP BY ALL ) SELECT user_id, component, SUM(time_decay_weight) AS total_weight FROM weighted_data GROUP BY All; User Info All Interation Credit White Colored User Brand Widget 20% White Colored User Deal of The Day 30% White Colored User Reco Boxes 50% User Info All Interation Credit White Colored User Brand Widget 20% White Colored User Deal of The Day 30% White Colored User Reco Boxes 50% User Info All Interation Credit User Info User Info All Interation All Interation Credit Credit White Colored User Brand Widget 20% White Colored User White Colored User Brand Widget Brand Widget 20% 20% White Colored User Deal of The Day 30% White Colored User White Colored User Deal of The Day Deal of The Day 30% 30% White Colored User Reco Boxes 50% White Colored User White Colored User Reco Boxes Reco Boxes 50% 50% It highlights the importance of recent interactions, providing a dynamic view of how proximity to the conversion impacts the effectiveness of each touchpoint. 5. U-Shape Model 5. U-Shape Model This model gives greater weight to the first and last touchpoints , while assigning less credit to the interactions in between. This model emphasizes the importance of the components that initially introduced the user to the brand and those that finalized the conversion. first last touchpoints Intermediate touchpoints, while still contributing, are considered less impactful as they primarily keep the user engaged throughout the journey. BigQuery: WITH touch_points AS ( SELECT user_id, component, ROW_NUMBER() OVER (PARTITION BY user_id ORDER BY timestamp) AS touch_order, COUNT(*) OVER (PARTITION BY user_id) AS total_touches FROM `project.dataset.user_journey` ) SELECT user_id, channel, CASE WHEN touch_order = 1 THEN 0.4 WHEN touch_order = total_touches THEN 0.4 ELSE 0.2 / (total_touches - 2) END AS u_shape_credit FROM touch_points; WITH touch_points AS ( SELECT user_id, component, ROW_NUMBER() OVER (PARTITION BY user_id ORDER BY timestamp) AS touch_order, COUNT(*) OVER (PARTITION BY user_id) AS total_touches FROM `project.dataset.user_journey` ) SELECT user_id, channel, CASE WHEN touch_order = 1 THEN 0.4 WHEN touch_order = total_touches THEN 0.4 ELSE 0.2 / (total_touches - 2) END AS u_shape_credit FROM touch_points; User Info All Interation Credit White Colored User Brand Widget 40% White Colored User Deal of The Day 20% White Colored User Reco Boxes 40% User Info All Interation Credit White Colored User Brand Widget 40% White Colored User Deal of The Day 20% White Colored User Reco Boxes 40% User Info All Interation Credit User Info User Info All Interation All Interation Credit Credit White Colored User Brand Widget 40% White Colored User White Colored User Brand Widget Brand Widget 40% 40% White Colored User Deal of The Day 20% White Colored User White Colored User Deal of The Day Deal of The Day 20% 20% White Colored User Reco Boxes 40% White Colored User White Colored User Reco Boxes Reco Boxes 40% 40% Benefits: Benefits: Highlights the most critical moments in the user journey (beginning and end). Optimizes coordination between components by identifying key contributors. Provides clear insights, especially for complex customer journeys. Highlights the most critical moments in the user journey (beginning and end). Optimizes coordination between components by identifying key contributors. Provides clear insights, especially for complex customer journeys. 6. W-Shape Model This model assigns greater credit to the first touchpoint , last touchpoint , and the most critical intermediate touchpoint right before the conversion. This model emphasizes multiple key moments in the user journey, providing a more balanced and comprehensive analysis of the interactions that drive conversions. first touchpoint last touchpoint most critical intermediate touchpoint BigQuery: WITH touch_points AS ( SELECT user_id, component, ROW_NUMBER() OVER (PARTITION BY user_id ORDER BY timestamp) AS touch_order, COUNT(*) OVER (PARTITION BY user_id) AS total_touches FROM `project.dataset.user_journey` ) SELECT user_id, component, CASE WHEN touch_order = 1 THEN 0.3 WHEN touch_order = total_touches THEN 0.3 WHEN touch_order = ROUND(total_touches / 2) THEN 0.3 ELSE 0.1 / (total_touches - 3) END AS w_shape_credit FROM touch_points; WITH touch_points AS ( SELECT user_id, component, ROW_NUMBER() OVER (PARTITION BY user_id ORDER BY timestamp) AS touch_order, COUNT(*) OVER (PARTITION BY user_id) AS total_touches FROM `project.dataset.user_journey` ) SELECT user_id, component, CASE WHEN touch_order = 1 THEN 0.3 WHEN touch_order = total_touches THEN 0.3 WHEN touch_order = ROUND(total_touches / 2) THEN 0.3 ELSE 0.1 / (total_touches - 3) END AS w_shape_credit FROM touch_points; User Info All Interation Credit White Colored User Brand Widget 40% White Colored User Deal of The Day 20% White Colored User Reco Boxes 40% User Info All Interation Credit White Colored User Brand Widget 40% White Colored User Deal of The Day 20% White Colored User Reco Boxes 40% User Info All Interation Credit User Info User Info All Interation All Interation Credit Credit White Colored User Brand Widget 40% White Colored User White Colored User Brand Widget Brand Widget 40% 40% White Colored User Deal of The Day 20% White Colored User White Colored User Deal of The Day Deal of The Day 20% 20% White Colored User Reco Boxes 40% White Colored User White Colored User Reco Boxes Reco Boxes 40% 40% Benefits: Benefits: Evaluates not only the first and last touchpoints but also other critical moments in the conversion journey. Ideal for identifying key interactions that play a significant role in driving conversions. Evaluates not only the first and last touchpoints but also other critical moments in the conversion journey. Evaluates not only the first and last touchpoints but also other critical moments in the conversion journey. Ideal for identifying key interactions that play a significant role in driving conversions. Ideal for identifying key interactions that play a significant role in driving conversions. The Key Difference Between U-Shape and W-Shape Models The Key Difference Between U-Shape and W-Shape Models The primary distinction between the U-Shape and W-Shape models lies in the weight assigned to intermediate components. While the U-Shape model distributes credit equally among all interactions between the first and last touchpoints, the W-Shape model assigns higher credit to intermediate interactions that are closer to the final touchpoint . equally all interactions between the first and last touchpoints, higher credit closer to the final touchpoint You can compare these two models using the example below to better understand how credit distribution differs in scenarios with multiple touchpoints. 7. Data-Driven Model 7. Data-Driven Model The data driven model leverages machine learning and data-driven algorithms to optimize credit allocation. By analyzing user behavior, this model learns the impact of each intraction on conversions, providing a dynamic and highly accurate understanding of touchpoint contributions. BigQuery: CREATE MODEL `project.dataset.attribution_model`OPTIONS(model_type='logistic_reg') AS SELECT * FROM `project.dataset.user_journey_training_data`; SELECT user_id, predicted_attribution FROM ML.PREDICT(MODEL `project.dataset.attribution_model`, (SELECT * FROM `project.dataset.user_journey_test_data`)); CREATE MODEL `project.dataset.attribution_model`OPTIONS(model_type='logistic_reg') AS SELECT * FROM `project.dataset.user_journey_training_data`; SELECT user_id, predicted_attribution FROM ML.PREDICT(MODEL `project.dataset.attribution_model`, (SELECT * FROM `project.dataset.user_journey_test_data`)); User Info All Interation Credit White Colored User Brand Widget 10% White Colored User Deal of The Day 30% White Colored User Reco Boxes 60% User Info All Interation Credit White Colored User Brand Widget 10% White Colored User Deal of The Day 30% White Colored User Reco Boxes 60% User Info All Interation Credit User Info User Info All Interation All Interation Credit Credit White Colored User Brand Widget 10% White Colored User White Colored User Brand Widget Brand Widget 10% 10% White Colored User Deal of The Day 30% White Colored User White Colored User Deal of The Day Deal of The Day 30% 30% White Colored User Reco Boxes 60% White Colored User White Colored User Reco Boxes Reco Boxes 60% 60% Benefits: Benefits: Provides dynamic and personalized analysis tailored to user behavior. Well-suited for working with large datasets, ensuring accurate insights at scale. Provides dynamic and personalized analysis tailored to user behavior. Well-suited for working with large datasets, ensuring accurate insights at scale. Conclusion Conclusion Working on our order attribution model has been an amazing experience at our company. It’s helped us understand how users interact with our platform and what drives their decisions. We’ve seen big benefits, from better team decisions to more useful insights. If you haven’t tried attribution modeling yet, I highly recommend it. Start small, focus on key touchpoints, and let the data show you the way. For us, it’s been a game changer, and we’re excited to keep improving it to make the user experience even better. Thank you for your time; sharing is caring! 🌍 Thank you for your time; sharing is caring! 🌍