paint-brush
Analyzing Ethereum Block Data with Bitquery's APIby@wise4rmgod
430 reads
430 reads

Analyzing Ethereum Block Data with Bitquery's API

by Wisdom NwokochaNovember 7th, 2023
Read on Terminal Reader
Read this story w/o Javascript
tldt arrow

Too Long; Didn't Read

In this tutorial, you will use Bitquery's API to analyze Ethereum block data. Bitquery's API provides access to various blockchain data, making it a powerful tool for analysis.
featured image - Analyzing Ethereum Block Data with Bitquery's API
Wisdom Nwokocha HackerNoon profile picture

Creating a web app for historical data analysis of blockchain data using React and Tailwind CSS is an excellent way to build a user-friendly and visually appealing application.


In this tutorial, you will use Bitquery's API to analyze Ethereum block data. Bitquery's API provides access to various blockchain data, making it a powerful tool for analysis.


You will focus on Ethereum blocks and extract valuable information from the provided data.

How to get Bitquery API

  • Go to https://explorer.bitquery.io/ to see blockchain data from different chains.

  • Click on any blockchain of your choice(for this tutorial, you will click Gorlie Ethereum Testnet)


  • To get the API, click the "Get API" button on the right.


  • Click the green button to query the blockchain.


  • You get a response data to analyze.


Prerequisites

Before you start, make sure you have the following prerequisites:

  1. Bitquery API Key: You need an API key from Bitquery to access their services. You can sign up for an account and obtain an API key from their website.
  2. API Client: You can use a tool like cURL or a programming language like javascript to request HTTP to the Bitquery API. ()
  3. Nodejs: Ensure you have Node.js and npm (Node Package Manager) installed on your computer. If you haven't already, you can install them from the official website: Node.js.

💡 This tutorial focuses on the first Ethereum block in the data.

Step 1: Create a New React App

Start by creating a new React app using Create React App. Open your terminal and run the following commands:

npx create-react-app blockchain-analysis-app
cd blockchain-analysis-app

Step 2: Install Dependencies

In your project directory, install the necessary dependencies.

You'll need Axios for making API requests, Chart.js for data visualization and Tailwind CSS for styling:


npm install axios chart.js tailwindcss

Step 3: Create Components

In the src Folder, create the following components:

  1. DataFetcher.js: This component will fetch historical blockchain data from Bitquery's API.
  2. Chart.js: This component will render the data using Chart.js for visualization.
  3. Report.js: This component will generate reports based on the data.

Step 4: Implement DataFetcher Component

In DataFetcher.js, you can use Axios to fetch historical blockchain data from Bitquery's API. Add this code to the DataFetcher.js


import React, { useEffect, useState } from "react";
import axios from "axios";

const DataFetcher = ({ onDataFetched }) => {
  const [historicalData, setHistoricalData] = useState([]);

  useEffect(() => {
    // Define your API endpoint
    const API_ENDPOINT = "https://graphql.bitquery.io/";
    // Define your API key
    const API_KEY = "YOUR_BITQUERY_API_KEY"; // Replace with your Bitquery API key

    // Define the query variables
    const variables = {
      network: "ethereum",
      limit: 10,
      offset: 0,
      from: "2023-10-01T00:00:00Z",
      till: "2023-10-30T23:59:59Z",
    };

    // Define the GraphQL query
    const query = `
      query ($network: EthereumNetwork!, $limit: Int!, $offset: Int!, $from: ISO8601DateTime, $till: ISO8601DateTime) {
        ethereum(network: $network) {
          blocks(
            options: {desc: "height", limit: $limit, offset: $offset}
            time: {since: $from, till: $till}
          ) {
            timestamp {
              time(format: "%Y-%m-%d %H:%M:%S")
            }
            height
            transactionCount
            address: miner {
              address
              annotation
            }
            reward
            reward_usd: reward(in: USD)
            rewardCurrency {
              symbol
            }
          }
        }
      }
    `;

    // Make an API request to fetch historical blockchain data from Bitquery
    axios
      .post(
        API_ENDPOINT,
        {
          query: query,
          variables: variables,
        },
        {
          headers: {
            "Content-Type": "application/json",
            "X-API-KEY": API_KEY,
          },
        }
      )
      .then((response) => {
        const data = response.data.data.ethereum.blocks;
        setHistoricalData(data);
        onDataFetched(data);
      })
      .catch((error) => {
        console.error("Error fetching data:", error);
      });
  }, []);

  return (
    <div>{/* Display a loading indicator or data summary if needed */}</div>
  );
};

export default DataFetcher;


💡 Replace 'YOUR_BITQUERY_API_KEY' with your actual Bitquery API key.

Step 5: Implement Chart Component

In Chart.js, you can use Chart.js to create visualizations from the historical data.

Add this code to the Chart.js


import React, { useEffect, useRef } from "react";
import Chart from "chart.js/auto";

const ChartComponent = ({ data }) => {
  const chartRef = useRef(null);
  const chartInstance = useRef(null);

  useEffect(() => {
    if (!data || data.length === 0 || !Array.isArray(data)) {
      return;
    }

    const ctx = chartRef.current.getContext("2d");

    // Destroy the previous Chart instance if it exists
    if (chartInstance.current) {
      chartInstance.current.destroy();
    }

    chartInstance.current = new Chart(ctx, {
      type: "line",
      data: {
        labels: data.map((item) => item.height),
        datasets: [
          {
            label: "Transaction Count",
            data: data.map((item) => item.transactionCount),
            borderColor: "rgb(75, 192, 192)",
            borderWidth: 1,
          },
        ],
      },
      options: {
        scales: {
          x: {
            type: "linear",
          },
        },
      },
    });
  }, [data]);

  return (
    <div className="w-full md:w-3/4 mx-auto">
      <canvas ref={chartRef}></canvas>
    </div>
  );
};

export default ChartComponent;


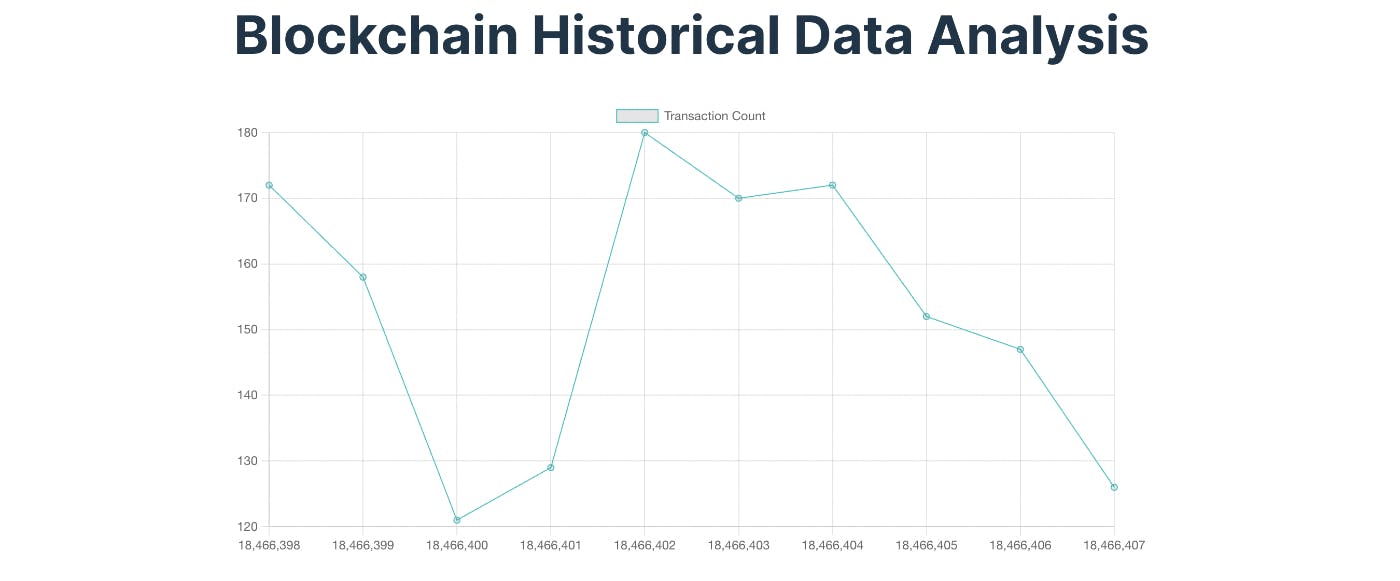
This component will render a line chart based on the historical data provided.

Step 6: Implement Report Component

In Report.js, you can generate reports based on historical blockchain data.

Add this code to the Report.js


import React from "react";

const Report = ({ data }) => {
  // Implement logic to generate reports from the data
  return <div></div>;
};

export default Report;

Step 7: Styling with Tailwind CSS

Tailwind CSS allows you to style your React components easily. You can customize the appearance of your components by adding Tailwind CSS classes directly to your JSX elements.


For example, in the code provided, Tailwind CSS classes are used for styling.

Step 8: Use Components in App.js

In src/App.js, you can use the created components to display the data, visualizations, and reports. Add this code to the App.js


import React, { useState } from 'react';
import './App.css';
import DataFetcher from './DataFetcher';
import ChartComponent from './Chart';
import Report from './Report';

function App() {
  const [historicalData, setHistoricalData] = useState([]);

  const onDataFetched = (data) => {
    setHistoricalData(data);
  };

  return (
    <div className="bg-gray-100 p-4">
      <div className="max-w-3xl mx-auto">
        <header className="bg-white p-4 shadow-md rounded-lg mb-4">
          <h1 className="text-2xl font-semibold mb-2">Blockchain Historical Data Analysis</h1>
          <DataFetcher onDataFetched={onDataFetched} />
          <ChartComponent data={historicalData} />
          <Report data={historicalData} />
        </header>
      </div>
    </div>
  );
}

export default App;

Step 9: Start the Development Server

Start your React app with the following command:


npm run dev


Your app will be available in your web browser at http://localhost:3000. It will fetch historical blockchain data, display it in a chart, and generate a simple report, all styled using Tailwind CSS.


Step 10: Analyzing the Response

After making the API request, you'll receive a JSON response from Bitquery.


Here's a breakdown of the important fields in the response:

  • timestamp: The timestamp when the block was mined.
  • height: The block's height or number.
  • transactionCount: The number of transactions in the block.
  • address: The address of the miner.
  • reward: The block reward in GTH (Gas Token Holder).
  • reward_usd: The block reward in USD.
  • rewardCurrency: The symbol of the currency used for the reward (in this case, GTH).

Conclusion

In this tutorial, you have seen how to use Bitquery's API to access and analyze Ethereum block data.

By leveraging the power of Bitquery, you can gain insights into the Ethereum network's activity and make informed decisions based on blockchain data.


You can extend this analysis to multiple blocks, timeframes, or any other criteria you need for your project.