


401 reads
An Introduction to Relative Strength Index Trading Strategies


Too Long; Didn't Read
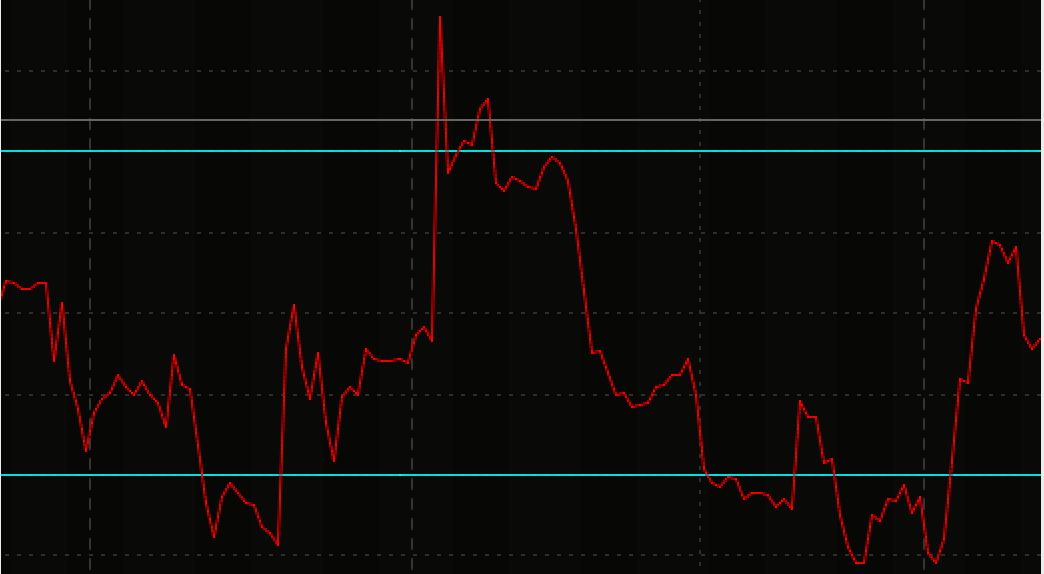
Relative Strength Index (RSI) is a momentum indicator. It measures the speed and change of price movements to evaluate if a stock is overbought or oversold. The traditional interpretation of the RSI sees the areas below 30% and above 70% as significant territories. RSI can also be used to reveal price trends and suggest points to enter and exit trades. Using RSI is pointless if you don’t understand how the value is computed and what it actually tells you.Company Mentioned


Leah Mathieson
@leah-mathieson
Writing about law, Wall Street, VC & startups.

L O A D I N G
. . . comments & more!
. . . comments & more!
About Author

TOPICS
THIS ARTICLE WAS FEATURED IN...


RELATED STORIES


Should you use a Sector Rotation Strategy? #trading
Oct 20, 2020

Left Curve #us-economy
Apr 24, 2024


Heatwave #cryptohayes
Apr 09, 2024

