paint-brush
80% of Issues Aren't Caught by Testing Alone: Build Your Data Reliability Stack to Reduce Downtimeby@liorgavish
156 reads

80% of Issues Aren't Caught by Testing Alone: Build Your Data Reliability Stack to Reduce Downtime

by Lior GavishApril 8th, 2022
Read on Terminal Reader
Read this story w/o Javascript
tldt arrow

Too Long; Didn't Read

Benjamin Treynor Sloss, a Google engineering manager, determined there had to be a better way to manage and prevent dizzying fire drills when the site was down and pioneered site reliability engineering. Like software, data systems are becoming increasingly complex, with multiple upstream and downstream dependencies. A modern data reliability stack consists of testing, CI/CD, data observability, and data discovery tools.

People Mentioned

Mention Thumbnail
Mention Thumbnail

Companies Mentioned

Mention Thumbnail
Mention Thumbnail

Coin Mentioned

Mention Thumbnail
featured image - 80% of Issues Aren't Caught by Testing Alone: Build Your Data Reliability Stack to Reduce Downtime
Lior Gavish HackerNoon profile picture

On July 26, 2004, a 5-year-old startup by the name of Google was faced with a serious problem: their application was down.


For several hours, users across the United States, France, and Great Britain were unable to access the popular search engine. The then-800-person company and their millions of users were left in the dark as engineers struggled to fix the problem and discover the root cause of the issue.


By midday, a tedious and intensive process conducted by a few panicked engineers determined that the MyDoom virus was to blame.


In 2021, an outage of that length and scale is considered rather anomalous, but 15 years ago, these types of software outages weren’t out of the ordinary. After leading teams through several of these experiences over the years, Benjamin Treynor Sloss, a Google engineering manager at the time, determined there had to be a better way to manage and prevent these dizzying fire drills, not just at Google but across the industry.


Inspired by his early career building data and IT infrastructure, Sloss codified his learnings as an entirely new discipline — site reliability engineering (SRE) — dedicated to optimizing the maintenance and operations of software systems (like Google’s search engine) with reliability in mind.


According to Sloss and others paving the way forward for the discipline, SRE was about automating away the need to worry about edge cases and unknown unknowns (like buggy code, server failures, and viruses). Ultimately, Sloss and his team wanted a way for engineers to automate away the manual toil of maintaining the company’s rapidly growing codebase while ensuring that their bases were covered when systems broke.


“SRE is a way of thinking and approaching production. Most engineers developing a system can also be an SRE for that system,” he said. “The question is: can they take a complex, maybe not well-defined problem and come up with a scalable, technically reasonable solution?”


If Google had the right processes and systems in place to anticipate and prevent downstream issues, not only could outages be easily fixed with minimal impact on users, but prevented altogether.

Data is Software and Software is Data

Nearly 20 years later, data teams are faced with a similar fate. Like software, data systems are becoming increasingly complex, with multiple upstream and downstream dependencies. Ten or even five years ago, it was normal and accepted to manage your data in silos, but now, teams and even entire companies are working with data, facilitating a more collaborative and fault-resistant approach to data management.


Over the past few years, we’ve witnessed the widespread adoption of software engineering best practices by data engineering and analytics teams to address this gap, from adopting open source tools like dbt and Apache Airflow for easier data transformation and orchestration to cloud-based data warehouses and lakes like Snowflake and Databricks.


Fundamentally, this shift towards agile principles relates to how we conceptualize, design, build, and maintain data systems. Long gone are the days of siloed dashboards and reports that are generated once, rarely used, and never updated; now, to be useful at scale, data must also be productized, maintained, and managed for consumption by end-users across the company.

And in order for data to be treated like a software product, it has to be as reliable as one, too.

The Rise of Data Reliability

Tweet courtesy of the ever-hilarious Seth Rosen, co-founder of TopCoat Data.

In short, data reliability is an organization’s ability to deliver high data availability and health throughout the entire data lifecycle, from ingestion to the end products: dashboards, ML models, and production datasets.


In the past, attention has been given to addressing different parts of the puzzle in isolation, from testing frameworks to data observability, but this approach is no longer sufficient. As any data engineer will tell you, however, data reliability (and the ability to truly treat data like a product) is not achieved in a silo.


A schema change in one data asset can affect multiple tables and even fields downstream in your Tableau dashboards. A missing value can send your finance team into hysterics when they’re querying new insights in Looker.


And when 500 rows suddenly turn into 5,000, it’s usually a sign that something isn’t right – you just don’t know where or how the table broke.


Even with the abundance of great data engineering tools and resources that exist, data can break for millions of different reasons, from operational issues and code changes to problems with the data itself.


After speaking to hundreds of data teams and through my own experience, I discovered that about 80 percent of data issues aren’t covered by testing alone. Image courtesy of Lior Gavish.


From my own experience and after talking to hundreds of teams, there are currently two ways most data engineers discover data quality issues: testing (the ideal outcome) and angry messages from your downstream stakeholders (the likely outcome).


In the same way that SREs manage application downtime, today’s data engineers must focus on reducing data downtime — periods of time when data is inaccurate, missing, or otherwise erroneous — through automation, continuous integration, and continuous deployment of data models, and other agile principles.


In the past, we’ve discussed how to build a quick and dirty data platform; now, we’re building on this design to reflect the next step in this journey towards good data: the data reliability stack.


Here’s how and why to build one.

Introducing: The Data Reliability Stack

Nowadays, data teams are tasked with building scalable, highly performant data platforms that can address the needs of cross-functional analytics teams by storing, processing, and piping data to generate accurate and timely insights.


But to get there, we also need the proper approach to ensuring that raw data is usable and trustworthy in the first place. To that end, some of the best teams are building data reliability stacks as part of their modern data platforms.


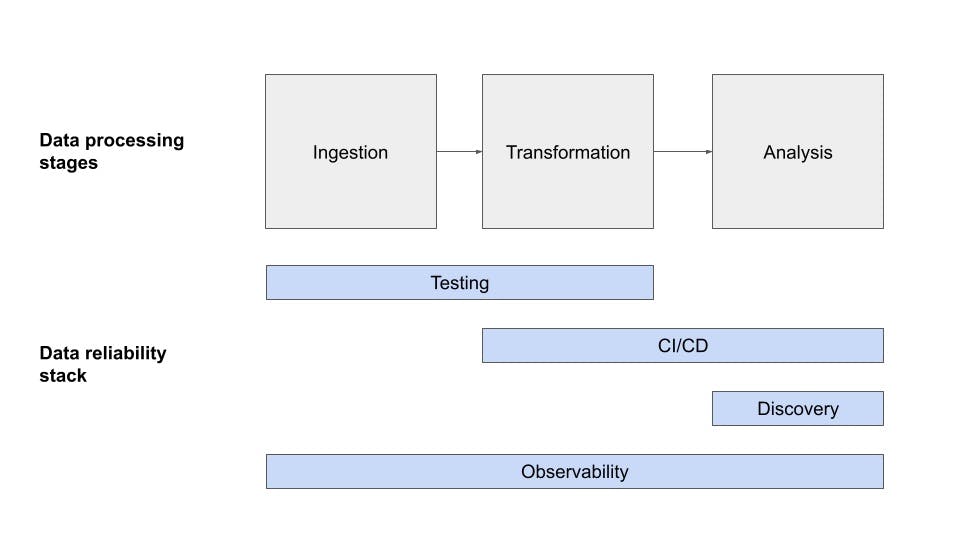
In my opinion, the modern data reliability stack is made up of four distinct layers: testing, CI/CD, data observability, and data discovery, each representative of a different step in your company’s data quality journey.

The Data Reliability stack is made up of five layers, including testing, CI/CD, Data Observability, and Data Discovery. Image courtesy of Lior Gavish.


Testing

Testing your data plays a crucial role in discovering data quality issues before it even enters a production data pipeline. With testing, engineers anticipate something might break and write logic to detect the issue preemptively.


Data testing is the process of validating your organizations’ assumptions about the data, either before or during production. Writing basic tests that check for things such as uniqueness and not_null are ways organizations can test out the basic assumptions they make about their source data.


It is also common for organizations to ensure that data is in the correct format for their team to work with and that the data meets their business needs.


Some of the most common data quality tests include:


  • Null values – are any values unknown (NULL)?

  • Volume – Did I get any data at all? Did I get too much or too little?

  • Distribution – is my data within an accepted range? Are my values in range within a given column?

  • Uniqueness – are any values duplicated?

  • Known invariants – is profit always the difference between revenue and cost, or some other well-known facts about my data?


From my own experience, two of the best tools out there to test your data are dbt tests and Great Expectations (as a more general-purpose tool). Both tools are open source and allow you to discover data quality issues before they end up in the hands of stakeholders.


While dbt is not a testing solution per se, their out-of-the-box tests work well if you’re already using the framework to model and transform your data

Continuous Integration (CI) / Continuous Delivery (CD)

CI/CD is a key component of the software development life cycle that ensures new code deployments are stable and reliable as updates are made over time, via automation.


In the context of data engineering, CI/CD relates not only to the process of integrating new code continuously but also to the process of integrating new data into the system. By detecting issues at an early stage, ideally as early as code is committed, or new data is merged – data teams are able to reach a faster, more reliable development workflow.


Let’s start with the code part of the equation. Just like traditional software engineers, data engineers benefit from using source control, for example, Github, to manage their code and transformations so that new code can be properly reviewed and version controlled.


A CI/CD system, for example, CircleCI or Jenkins (open source), with a fully automated testing and deployment setup can create more predictability and consistency in deploying code.


This should all sound very familiar. Where data teams encounter an extra level of complexity is the challenge of understanding how code changes might impact the dataset that it outputs.


That’s where emerging tools come in that allow teams to compare the data output of a new piece of code to a previous run of that same code. By catching unexpected data discrepancies early in the process, before code is deployed, higher reliability is achieved. While representative staging or production data is required for this process, it can be highly effective.


There is also another family of tools designed to help teams ship new data, rather than new code, more reliably. With LakeFS or Project Nessie, teams are able to stage their data before publishing it for downstream consumption with git-like semantics.


Imagine creating a branch with newly processed data, and only committing it to the main branch if it’s deemed good! In conjunction with testing, data branching can be a very powerful way to block bad data from ever reaching downstream consumers.

Data Observability

Testing and versioning data pre-production is a great first step towards achieving data reliability, but what happens when data breaks in production–and beyond?


In addition to elements of the data reliability stack that tackle data quality before transformation and modeling, data engineering teams need to invest in end-to-end, automated data observability solutions that can detect when data issues occur in near-real-time.


Similar to DevOps Observability solutions (i.e., Datadog and New Relic), data observability uses automated monitoring, alerting, and triaging to identify and evaluate data quality issues.


Data observability is measured across five key pillars of data health and reliability: freshness, distribution, volume, schema, and lineage:


  • Freshness: Is the data recent? When was the last time it was generated? What upstream data is included and or omitted?

  • Distribution: Is the data within accepted ranges? Is it the right format? Is it complete?

  • Volume: Has all the data arrived? Was data duplicated by accident? How much data was removed from a table?

  • Schema: What is the schema, and how has it changed? Who made changes to the schema and for what reasons?

  • Lineage: For a given data asset, what are the upstream and downstream sources that are impacted by it? Who are the one’s generating this data, and who is relying on the data for decision making?


Data observability accounts for the other 80 percent of data downtime your team can’t predict (unknowns unknowns), not just detecting and alerting on data quality issues, but also providing root cause analysis, impact analysis, field-level lineage, and operational insights on your data platform.


With these tools, your team will be well-equipped to not just address but also prevent similar issues from occurring in the future through historical and statistical insights into the reliability of your data.

Data Discovery

While not traditionally considered a part of the reliability stack, we believe data discovery is critical. One of the most common ways teams create unreliable data is by overlooking assets that already exist and creating new datasets that significantly overlap, or even contradict, existing ones.


This creates confusion among consumers in the organization around which data is most relevant for a particular business question, and diminishes trust and perceived reliability. It also creates a huge amount of data debt for data engineering teams.


Without good discovery in place, teams find themselves needing to maintain dozens of different datasets all describing the same dimensions or facts. The complexity alone makes further development a challenge, and high reliability extremely hard.


While data discovery is an extremely challenging problem to solve, data catalogs have made inroads towards greater democratization and accessibility. For instance, we’ve witnessed how solutions like Atlandata.world, and Stemma can address these two concerns.


Simultaneously, data observability solutions can help eliminate a lot of the commonly perceived reliability issues and data debt challenges required to achieve data discovery. By pulling together metadata, lineage, quality indicators, usage patterns as well as human-generated documentation, data observability can answer questions like:


  • What data is available to me to describe our customers?
  • Which dataset should I trust most?
  • How can I use that dataset?
  • Who are the experts that can help answer questions about it?


In short, these tools introduce a way for data consumers and producers to find the dataset or report they need and avoid those duplicated efforts.


Democratizing this information and making it available to any person that uses or creates data is a critical piece of the reliability puzzle.

The Future of Data Reliability

As the data becomes more and more integral to the day-to-day operations of modern business and powers digital products, the need for reliable data will only increase, as will the technical requirements around ensuring this trust.


Still, while your stack will get you some of the ways there, data reliability isn’t solved with technology alone. The strongest approaches also incorporate culture and organizational shifts to prioritize governance, privacy, and security, all three areas of the modern data stack ripe for acceleration for the next several years.


Another powerful tool in your data reliability arsenal is to prioritize service-level agreements (SLAs) and other measures to track the frequency of issues relative to agreed expectations set with your stakeholders, another tried and true best practice gleaned from software engineering.


Such metrics will be critical as your organization makes the move toward treating data as a product and data teams less like financial analysts more like product and engineering teams.


In the meantime, here’s wishing you no data downtime – and plenty of uptime!